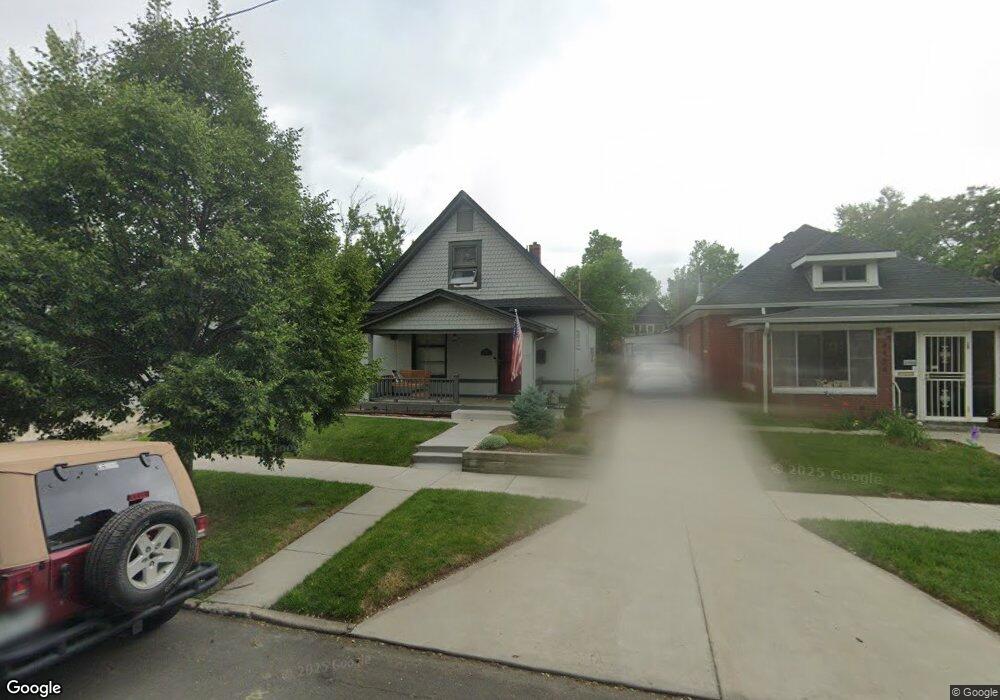
3120 W 35th Ave Denver, CO 80211
West Highland NeighborhoodEstimated Value: $703,000 - $786,000
2
Beds
1
Bath
1,182
Sq Ft
$630/Sq Ft
Est. Value
About This Home
This home is located at 3120 W 35th Ave, Denver, CO 80211 and is currently estimated at $745,056, approximately $630 per square foot. 3120 W 35th Ave is a home located in Denver County with nearby schools including Edison Elementary School, Bryant Webster Dual Language School, and Skinner Middle School.
Ownership History
Date
Name
Owned For
Owner Type
Purchase Details
Closed on
Mar 30, 2022
Sold by
Theodosia Haskell Mary
Bought by
Gallagher Erin and Gallagher Mark
Current Estimated Value
Home Financials for this Owner
Home Financials are based on the most recent Mortgage that was taken out on this home.
Original Mortgage
$624,000
Outstanding Balance
$587,174
Interest Rate
4.42%
Mortgage Type
New Conventional
Estimated Equity
$157,882
Purchase Details
Closed on
Jun 15, 1999
Sold by
Hernandez Jimmy L and Elki Neiberger
Bought by
Haskell Mary Theodosia
Home Financials for this Owner
Home Financials are based on the most recent Mortgage that was taken out on this home.
Original Mortgage
$142,000
Interest Rate
7.02%
Purchase Details
Closed on
Apr 28, 1994
Sold by
Galindo Janice E
Bought by
Hernandez Jimmy L and Neiberger Elki
Home Financials for this Owner
Home Financials are based on the most recent Mortgage that was taken out on this home.
Original Mortgage
$88,590
Interest Rate
7.71%
Mortgage Type
FHA
Create a Home Valuation Report for This Property
The Home Valuation Report is an in-depth analysis detailing your home's value as well as a comparison with similar homes in the area
Home Values in the Area
Average Home Value in this Area
Purchase History
| Date | Buyer | Sale Price | Title Company |
|---|---|---|---|
| Gallagher Erin | $780,000 | None Listed On Document | |
| Haskell Mary Theodosia | $177,500 | Empire Title & Escrow | |
| Hernandez Jimmy L | $89,850 | -- |
Source: Public Records
Mortgage History
| Date | Status | Borrower | Loan Amount |
|---|---|---|---|
| Open | Gallagher Erin | $624,000 | |
| Previous Owner | Haskell Mary Theodosia | $142,000 | |
| Previous Owner | Hernandez Jimmy L | $88,590 |
Source: Public Records
Tax History Compared to Growth
Tax History
| Year | Tax Paid | Tax Assessment Tax Assessment Total Assessment is a certain percentage of the fair market value that is determined by local assessors to be the total taxable value of land and additions on the property. | Land | Improvement |
|---|---|---|---|---|
| 2024 | $3,547 | $44,780 | $26,350 | $18,430 |
| 2023 | $3,470 | $44,780 | $26,350 | $18,430 |
| 2022 | $2,485 | $38,200 | $21,810 | $16,390 |
| 2021 | $2,399 | $39,300 | $22,440 | $16,860 |
| 2020 | $2,002 | $34,130 | $22,440 | $11,690 |
| 2019 | $1,946 | $34,130 | $22,440 | $11,690 |
| 2018 | $1,878 | $31,470 | $19,370 | $12,100 |
| 2017 | $1,872 | $31,470 | $19,370 | $12,100 |
| 2016 | $1,634 | $28,000 | $17,846 | $10,154 |
| 2015 | $1,566 | $28,000 | $17,846 | $10,154 |
| 2014 | $1,212 | $22,550 | $10,929 | $11,621 |
Source: Public Records
Map
Nearby Homes
- 3159 W 36th Ave
- 3249 W Fairview Place Unit 106
- 3249 W Fairview Place Unit 111
- 3055 W 36th Ave
- 3334 W 37th Ave
- 3361 W 36th Ave
- 3434 Julian St
- 3725 Federal Blvd
- 3116 W 32nd Ave
- 3130 W 38th Ave Unit 4
- 3425 W 35th Ave
- 3050 W 32nd Ave Unit 102C
- 3050 W 32nd Ave Unit 202C
- 3639 Eliot St
- 3363 W 32nd Ave
- 2929 W 37th Ave
- 2845 W 36th Ave
- 3455 W 35th Ave
- 3358 W 32nd Ave
- 3362 W 32nd Ave
- 3124 W 35th Ave
- 3128 W 35th Ave
- 3439 Grove St
- 3136 W 35th Ave
- 3425 Grove St
- 3142 W 35th Ave
- 3121 W 35th Ave
- 3127 W 35th Ave
- 3115 W 35th Ave
- 3105 W 35th Ave
- 3148 W 35th Ave
- 3137 W 35th Ave
- 3127 W 34th Ave
- 3115 W 34th Ave
- 3111 W 34th Ave
- 3129 W 34th Ave
- 3137 W 34th Ave
- 3440 Grove St
- 3430 Grove St
- 3156 W 35th Ave