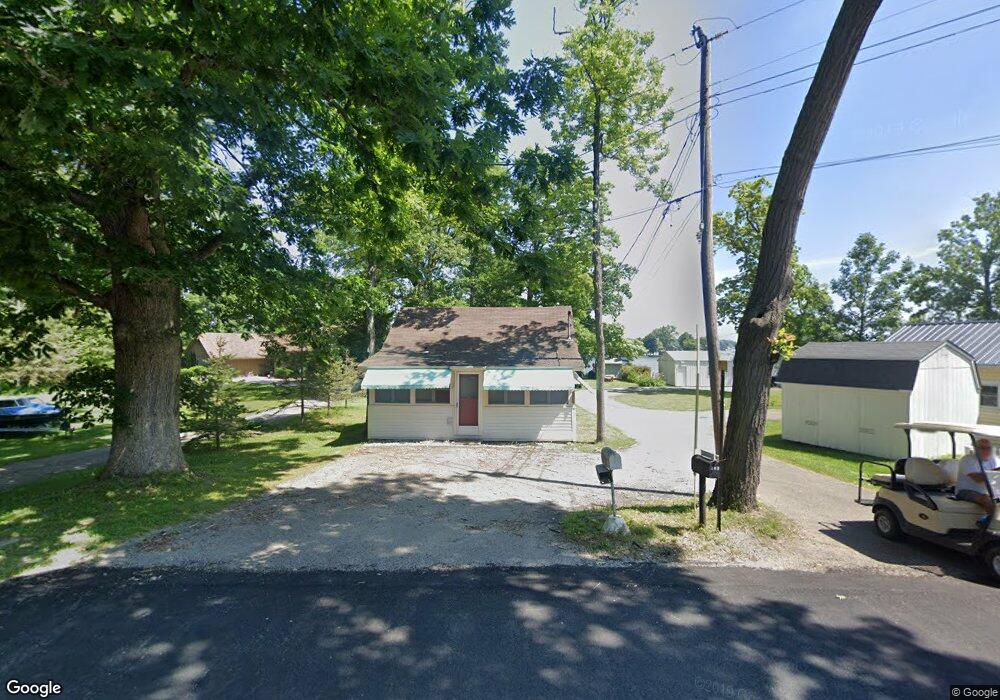
3120 W Shady Side Rd Angola, IN 46703
Estimated Value: $165,281 - $418,000
1
Bed
1
Bath
491
Sq Ft
$493/Sq Ft
Est. Value
About This Home
This home is located at 3120 W Shady Side Rd, Angola, IN 46703 and is currently estimated at $241,820, approximately $492 per square foot. 3120 W Shady Side Rd is a home located in Steuben County with nearby schools including Angola High School and Grace Baptist Academy.
Ownership History
Date
Name
Owned For
Owner Type
Purchase Details
Closed on
Sep 21, 2018
Sold by
Weisman Gregg F and Weisman Amy M
Bought by
Eversole Richard W
Current Estimated Value
Home Financials for this Owner
Home Financials are based on the most recent Mortgage that was taken out on this home.
Original Mortgage
$109,900
Outstanding Balance
$38,289
Interest Rate
4.5%
Mortgage Type
New Conventional
Estimated Equity
$203,531
Purchase Details
Closed on
Dec 10, 2001
Sold by
Reinhard Marvin L and Reinhard Kim
Bought by
Weisman Gregg F and Weisman Amy M Te
Purchase Details
Closed on
Apr 19, 2001
Sold by
Reinhard Marvin L and Reinhard Kim R
Bought by
Reinhard Marvin L
Purchase Details
Closed on
Nov 23, 1999
Sold by
Kaehr Thomas R and Kaehr Mary
Bought by
Reinhard Marvin L and Reinhard Kim R
Purchase Details
Closed on
Feb 16, 1999
Sold by
Graft Kenneth A and Graft Barbara J
Bought by
Kaehr Thomas R
Create a Home Valuation Report for This Property
The Home Valuation Report is an in-depth analysis detailing your home's value as well as a comparison with similar homes in the area
Home Values in the Area
Average Home Value in this Area
Purchase History
| Date | Buyer | Sale Price | Title Company |
|---|---|---|---|
| Eversole Richard W | $279,900 | Trademark Title | |
| Weisman Gregg F | $173,100 | -- | |
| Reinhard Marvin L | -- | -- | |
| Reinhard Marvin L | $158,000 | -- | |
| Kaehr Thomas R | $155,000 | -- |
Source: Public Records
Mortgage History
| Date | Status | Borrower | Loan Amount |
|---|---|---|---|
| Open | Eversole Richard W | $109,900 |
Source: Public Records
Tax History Compared to Growth
Tax History
| Year | Tax Paid | Tax Assessment Tax Assessment Total Assessment is a certain percentage of the fair market value that is determined by local assessors to be the total taxable value of land and additions on the property. | Land | Improvement |
|---|---|---|---|---|
| 2024 | $652 | $74,300 | $27,900 | $46,400 |
| 2023 | $630 | $71,200 | $26,600 | $44,600 |
| 2022 | $556 | $62,700 | $25,100 | $37,600 |
| 2021 | $551 | $59,100 | $25,100 | $34,000 |
| 2020 | $488 | $53,700 | $22,800 | $30,900 |
| 2019 | $502 | $52,400 | $22,800 | $29,600 |
| 2018 | $517 | $51,300 | $22,800 | $28,500 |
| 2017 | $496 | $48,100 | $22,300 | $25,800 |
| 2016 | $499 | $47,800 | $22,300 | $25,500 |
| 2014 | $313 | $28,400 | $2,900 | $25,500 |
| 2013 | $313 | $24,100 | $2,900 | $21,200 |
Source: Public Records
Map
Nearby Homes
- 51 Lane 345 Cooked Lake
- 35 Ln 345 Crooked Lake
- 15 Ln 345 Crooked Lake
- 31 Ln 345 Crooked Lake
- 43 Ln 345 Crooked Lake
- 39 Ln 345 Crooked Lake
- 47 Ln 345 Crooked Lake
- 27 Ln 345 Crooked Lake
- 23 Ln 345 Crooked Lake
- 19 Ln 345 Crooked Lake
- 1000 N 330 W
- 3095 W 100 N
- 3795 W Sycamore Beach Rd
- 905 N 280 W
- 255 Lane 102 Crooked Lake
- 865 N 280 W
- 2255 N 400 W
- 2245 W Orland Rd
- 735 Lane 274 Crooked Lake
- 2530 N 200 Rd W
- 3110 W Shady Side Rd
- 55 Lane 155 Crooked Lake
- 75 Ln 155 Crooked Lake
- 3140 W Shady Side Rd
- 95 Lane 155 Crooked Lake
- 3100 W Shady Side Rd
- 3090 W Shady Side Rd
- 3090 W Shady Side Rd
- 155 Lane 155 Crooked Lake
- 120 Lane 160 Crooked Lake
- 175 Lane 155 Crooked Lake
- 140 Lane 160 Crooked Lake
- 160 Lane 160 Crooked Lake
- 3070 W Shady Side Rd
- 40 Lane 163 Crooked Lake
- 180 Lane 160 Crooked Lake
- 3060 W Shady Side Rd
- 60 Lane 163 Crooked Lake
- 200 Lane 160 Crooked Lake
- 220 Lane 160 Crooked Lake