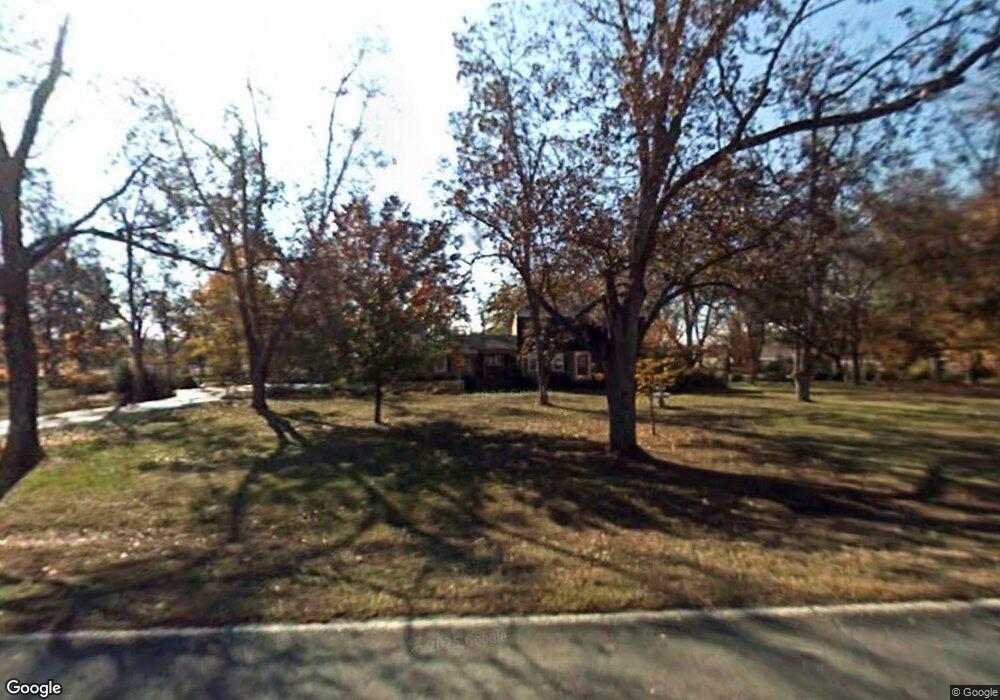
3120 Walden Rd Macon, GA 31216
Estimated Value: $279,000 - $330,000
4
Beds
3
Baths
2,538
Sq Ft
$123/Sq Ft
Est. Value
About This Home
This home is located at 3120 Walden Rd, Macon, GA 31216 and is currently estimated at $313,397, approximately $123 per square foot. 3120 Walden Rd is a home located in Bibb County with nearby schools including Heard Elementary School, Rutland Middle School, and Rutland High School.
Ownership History
Date
Name
Owned For
Owner Type
Purchase Details
Closed on
May 24, 2024
Sold by
Francis Norman and Francis Ingrid
Bought by
Tharp James Buford and Tharp Emily Ann
Current Estimated Value
Home Financials for this Owner
Home Financials are based on the most recent Mortgage that was taken out on this home.
Original Mortgage
$314,204
Outstanding Balance
$309,693
Interest Rate
7.09%
Mortgage Type
FHA
Estimated Equity
$3,704
Purchase Details
Closed on
Oct 12, 2021
Sold by
Morris Bank
Bought by
Francis Norman and Francis Ingrid
Purchase Details
Closed on
Jan 5, 2021
Sold by
Keene Jay Campbell
Bought by
Morris Bank
Purchase Details
Closed on
Jul 29, 2015
Sold by
Cape Barbara and Cape Hannah Noel
Bought by
Keene Jay Campbell
Purchase Details
Closed on
Sep 14, 2008
Sold by
Cape Jerry L
Bought by
Cape Barbara and Hannah Noel
Create a Home Valuation Report for This Property
The Home Valuation Report is an in-depth analysis detailing your home's value as well as a comparison with similar homes in the area
Home Values in the Area
Average Home Value in this Area
Purchase History
| Date | Buyer | Sale Price | Title Company |
|---|---|---|---|
| Tharp James Buford | $320,000 | None Listed On Document | |
| Francis Norman | $185,100 | None Available | |
| Morris Bank | $153,011 | None Available | |
| Keene Jay Campbell | $192,500 | None Available | |
| Cape Barbara | -- | -- |
Source: Public Records
Mortgage History
| Date | Status | Borrower | Loan Amount |
|---|---|---|---|
| Open | Tharp James Buford | $314,204 |
Source: Public Records
Tax History Compared to Growth
Tax History
| Year | Tax Paid | Tax Assessment Tax Assessment Total Assessment is a certain percentage of the fair market value that is determined by local assessors to be the total taxable value of land and additions on the property. | Land | Improvement |
|---|---|---|---|---|
| 2025 | $2,846 | $115,792 | $11,160 | $104,632 |
| 2024 | $2,164 | $92,216 | $8,928 | $83,288 |
| 2023 | $2,308 | $84,916 | $8,928 | $75,988 |
| 2022 | $2,321 | $74,818 | $14,500 | $60,318 |
| 2021 | $2,843 | $74,818 | $14,500 | $60,318 |
| 2020 | $2,905 | $74,818 | $14,500 | $60,318 |
| 2019 | $2,929 | $74,818 | $14,500 | $60,318 |
| 2018 | $4,665 | $74,818 | $14,500 | $60,318 |
| 2017 | $2,803 | $74,818 | $14,500 | $60,318 |
| 2016 | $2,589 | $74,818 | $14,500 | $60,318 |
| 2015 | $2,831 | $72,198 | $14,500 | $57,698 |
| 2014 | $944 | $72,198 | $14,500 | $57,698 |
Source: Public Records
Map
Nearby Homes
- 3160 Walden Rd
- 116 Wynens Way
- DUPONT Plan at Quail Ridge
- GARDNER Plan at Quail Ridge
- KINGSTON Plan at Quail Ridge
- ESSEX Plan at Quail Ridge
- 408 Resting Fawn Place
- 708 Coopers Lnd
- 465 Bob White Rd
- 6530 Bevin Dr
- 0 Ponderosa Dr
- 411 Bob White Rd
- 428 Bob White Rd
- 4037 Liberty Estates Dr
- 4025 Liberty Estates Dr
- 436 Joseph Chandler Dr
- 3150 Holleman Dr
- 0 Houston Rd Unit 10572705
- 261 Amanda Dr
- 3120 Walden Rd
- 3142 Walden Rd
- 3111 Walden Rd
- 3141 Walden Rd
- 3345 S Walden Rd
- 3129 Walden Rd
- 3065 Walden Rd
- 3145 Walden Rd
- 3154 Walden Rd
- 3151 Walden Rd
- 3055 Walden Rd
- 3369 S Walden Rd
- 3163 Walden Rd
- 3035 Walden Rd
- 3170 Walden Rd
- 2072 Derbyshire Dr
- 2076 Derbyshire Dr
- 2080 Derbyshire Dr
- 3175 Walden Rd
- 3359 S Walden Rd