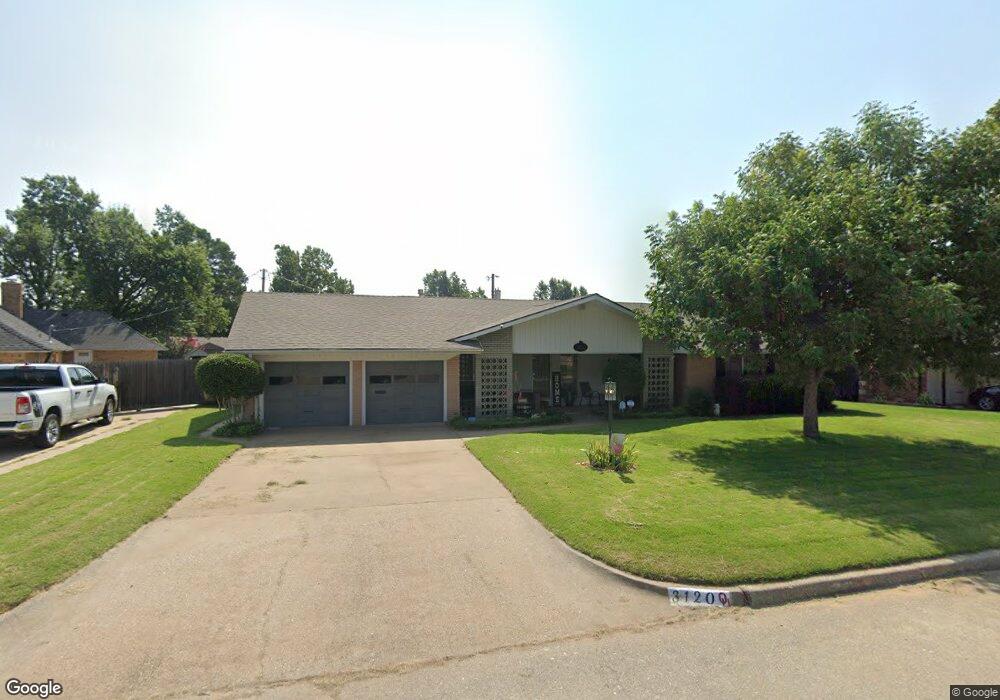
3120 Windsor Blvd Oklahoma City, OK 73122
Windsor Hills NeighborhoodEstimated Value: $237,391 - $250,000
3
Beds
2
Baths
1,994
Sq Ft
$122/Sq Ft
Est. Value
About This Home
This home is located at 3120 Windsor Blvd, Oklahoma City, OK 73122 and is currently estimated at $243,098, approximately $121 per square foot. 3120 Windsor Blvd is a home located in Oklahoma County with nearby schools including Windsor Hills Elementary School, Mayfield Middle School, and Putnam City West High School.
Ownership History
Date
Name
Owned For
Owner Type
Purchase Details
Closed on
Nov 6, 2012
Sold by
Fietz John and Estate Of Wanda Jean Fietz
Bought by
Fietz Amanda
Current Estimated Value
Home Financials for this Owner
Home Financials are based on the most recent Mortgage that was taken out on this home.
Original Mortgage
$117,727
Outstanding Balance
$82,725
Interest Rate
3.75%
Mortgage Type
FHA
Estimated Equity
$160,373
Purchase Details
Closed on
Nov 13, 2001
Sold by
Dillon Joseph D and Dillon Carole A
Bought by
Fietz Wanda J
Home Financials for this Owner
Home Financials are based on the most recent Mortgage that was taken out on this home.
Original Mortgage
$88,000
Interest Rate
6.59%
Purchase Details
Closed on
Aug 22, 2001
Sold by
Hodgson Ruth W and The Ruth W Hodgson Living Trus
Bought by
Dillon Joseph D and Dillon Carole A
Purchase Details
Closed on
Aug 1, 2001
Sold by
Swink Monica L and Roger K Hodgson Living Trust
Bought by
Hodgson Ruth W and Ruth W Hodgson Living Trust
Create a Home Valuation Report for This Property
The Home Valuation Report is an in-depth analysis detailing your home's value as well as a comparison with similar homes in the area
Home Values in the Area
Average Home Value in this Area
Purchase History
| Date | Buyer | Sale Price | Title Company |
|---|---|---|---|
| Fietz Amanda | $120,000 | None Available | |
| Fietz Wanda J | $110,000 | First Amer Title & Trust Co | |
| Dillon Joseph D | $106,000 | First Amer Title & Trust Co | |
| Hodgson Ruth W | -- | -- |
Source: Public Records
Mortgage History
| Date | Status | Borrower | Loan Amount |
|---|---|---|---|
| Open | Fietz Amanda | $117,727 | |
| Previous Owner | Fietz Wanda J | $88,000 |
Source: Public Records
Tax History Compared to Growth
Tax History
| Year | Tax Paid | Tax Assessment Tax Assessment Total Assessment is a certain percentage of the fair market value that is determined by local assessors to be the total taxable value of land and additions on the property. | Land | Improvement |
|---|---|---|---|---|
| 2024 | $2,464 | $21,226 | $3,267 | $17,959 |
| 2023 | $2,464 | $20,215 | $2,455 | $17,760 |
| 2022 | $2,376 | $19,252 | $2,636 | $16,616 |
| 2021 | $2,241 | $18,336 | $2,892 | $15,444 |
| 2020 | $2,125 | $17,463 | $2,949 | $14,514 |
| 2019 | $1,994 | $16,632 | $2,483 | $14,149 |
| 2018 | $1,901 | $15,840 | $0 | $0 |
| 2017 | $1,917 | $15,938 | $2,559 | $13,379 |
| 2016 | $1,822 | $15,179 | $2,570 | $12,609 |
| 2015 | $1,796 | $14,787 | $3,311 | $11,476 |
| 2014 | $1,685 | $14,425 | $3,311 | $11,114 |
Source: Public Records
Map
Nearby Homes
- 4908 NW 32nd St
- 2900 N Windsor Blvd
- 4612 NW 33rd Terrace
- 4900 NW 34th St
- 4612 NW 33rd Dr
- 4901 NW 34th St
- 3508 N Ann Arbor Place
- 2805 Tudor Rd
- 2704 N Harvard Ave
- 4917 NW 26th St
- 4608 NW 34th St
- 4997 NW 30th Place
- 4621 NW 34th St
- 4838 NW 26th St
- 2613 N Windsor Place
- 2800 N Meridian Ct
- 3408 N Preston Dr
- 2620 N Ann Arbor Ave Unit 208
- 5717 NW 31st Terrace
- 5716 NW 31st St
- 3116 Windsor Blvd
- 3121 Astoria Blvd
- 3128 Windsor Blvd
- 3117 Astoria Blvd
- 3121 Windsor Blvd
- 3112 Windsor Blvd
- 3117 Windsor Blvd
- 3125 Windsor Blvd
- 3113 Astoria Blvd
- 3129 Windsor Blvd
- 3113 Windsor Blvd
- 3124 Astoria Blvd
- 3128 Astoria Blvd
- 3108 Windsor Blvd
- 3201 Astoria Blvd
- 3120 Astoria Blvd
- 3109 Windsor Blvd
- 3109 Astoria Blvd
- 3116 Astoria Blvd
- 3204 Astoria Blvd