3121 Barry Trace Ct Unit 3121 Dublin, OH 43017
Estimated Value: $455,304 - $478,000
3
Beds
3
Baths
2,571
Sq Ft
$183/Sq Ft
Est. Value
About This Home
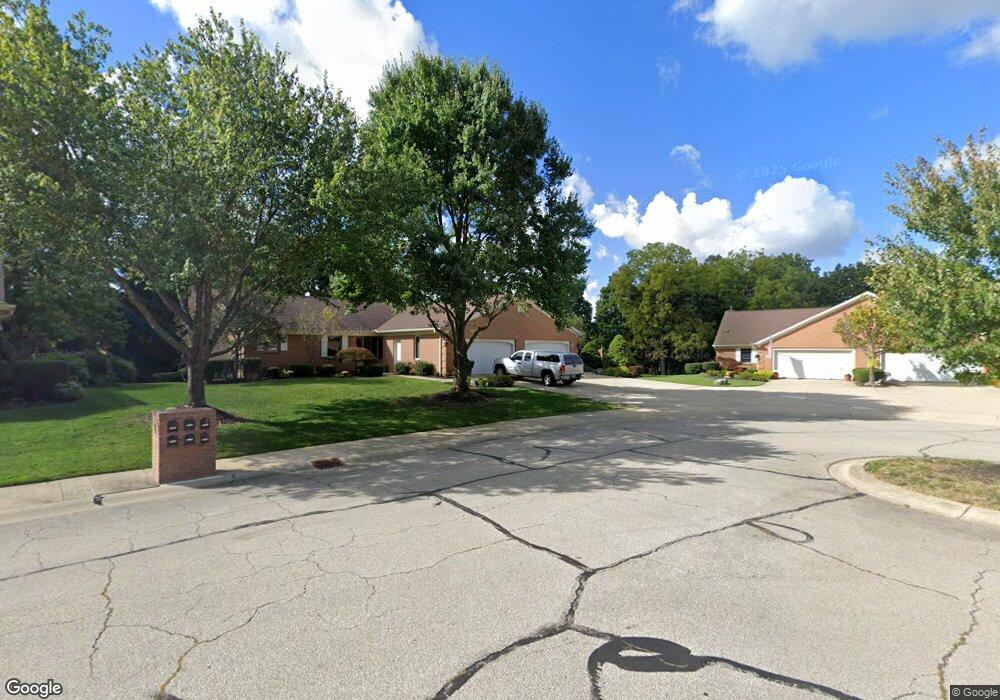
This home is located at 3121 Barry Trace Ct Unit 3121, Dublin, OH 43017 and is currently estimated at $471,576, approximately $183 per square foot. 3121 Barry Trace Ct Unit 3121 is a home located in Franklin County with nearby schools including Thomas Elementary School, John Sells Middle School, and Dublin Coffman High School.
Ownership History
Date
Name
Owned For
Owner Type
Purchase Details
Closed on
Jun 25, 2010
Sold by
Bundy E Leroy and Williams Janice T
Bought by
Coupland Gene A and Coupland Christine
Current Estimated Value
Purchase Details
Closed on
Mar 1, 2007
Sold by
Mount John T
Bought by
Bundy E Leroy and Bundy Janice T
Home Financials for this Owner
Home Financials are based on the most recent Mortgage that was taken out on this home.
Original Mortgage
$252,000
Interest Rate
6.4%
Mortgage Type
Purchase Money Mortgage
Purchase Details
Closed on
Aug 21, 2006
Sold by
Mount John T
Bought by
Mount John T
Purchase Details
Closed on
Feb 28, 2000
Sold by
Weltzheimer William A and Weltzheimer Carolyn F
Bought by
Mount John T and Mount Carroll C
Purchase Details
Closed on
May 27, 1994
Bought by
Weltzheimer William A
Create a Home Valuation Report for This Property
The Home Valuation Report is an in-depth analysis detailing your home's value as well as a comparison with similar homes in the area
Home Values in the Area
Average Home Value in this Area
Purchase History
| Date | Buyer | Sale Price | Title Company |
|---|---|---|---|
| Coupland Gene A | $321,000 | Talon Group | |
| Bundy E Leroy | $315,000 | Talon Group | |
| Mount John T | -- | None Available | |
| Mount John T | $310,000 | Franklin Abstract | |
| Weltzheimer William A | $245,800 | -- |
Source: Public Records
Mortgage History
| Date | Status | Borrower | Loan Amount |
|---|---|---|---|
| Previous Owner | Bundy E Leroy | $252,000 |
Source: Public Records
Tax History
| Year | Tax Paid | Tax Assessment Tax Assessment Total Assessment is a certain percentage of the fair market value that is determined by local assessors to be the total taxable value of land and additions on the property. | Land | Improvement |
|---|---|---|---|---|
| 2025 | $8,451 | $136,890 | $23,280 | $113,610 |
| 2024 | $8,451 | $136,890 | $23,280 | $113,610 |
| 2023 | $8,484 | $136,885 | $23,275 | $113,610 |
| 2022 | $7,878 | $119,880 | $25,200 | $94,680 |
| 2021 | $8,005 | $119,880 | $25,200 | $94,680 |
| 2020 | $7,959 | $119,880 | $25,200 | $94,680 |
| 2019 | $7,492 | $99,890 | $21,000 | $78,890 |
| 2018 | $7,674 | $99,890 | $21,000 | $78,890 |
| 2017 | $7,357 | $99,890 | $21,000 | $78,890 |
| 2016 | $7,771 | $105,000 | $14,560 | $90,440 |
| 2015 | $7,820 | $105,000 | $14,560 | $90,440 |
| 2014 | $7,828 | $105,000 | $14,560 | $90,440 |
| 2013 | $3,981 | $103,880 | $13,230 | $90,650 |
Source: Public Records
Map
Nearby Homes
- 3166 Kingstree Ct
- 5790 Newgate Rd Unit 5790
- 3122 Tromley Ct
- 3128 Rivermill Dr Unit 1
- 5935 Abbey Church Rd
- 3064 Meadowsglen Ct
- 6074 Hildenboro Dr
- 6117 Maryhurst Dr
- 2744 Greystone Dr Unit E
- 2667 Trottersway Dr Unit 62667
- 3327 Wolf Ridge Dr
- 2733 Greystone Dr Unit D
- 6171 Water Bank St
- 6187 Water Bank St
- 3263 Scioto Ridge Rd
- 4316 Shire Cove Rd
- 2985 Grandwoods Cir
- 2544 Maxim Ln Unit 37C
- 2542 Hyacinth Ln Unit 32C
- 2540 Dahlia Way Unit 26D
- 3119 Barry Trace Ct
- 3127 Barry Trace Ct
- 3111 Barry Trace Ct Unit 3111
- 3122 Kingsmead Trace Unit 3122
- 3129 Barry Trace Ct Unit 3129
- 3120 Kingsmead Trace Unit 3120
- 3128 Kingsmead Trace Unit 3128
- 3120 Barry Trace Ct Unit 3120
- 3109 Barry Trace Ct Unit 3109
- 3130 Kingsmead Trace Unit 3130
- 3130 Kingsmead Trace Unit HAYDEN FALLS
- 3110 Kingsmead Trace Unit 3110
- 3118 Barry Trace Ct
- 3108 Kingsmead Trace Unit 3108
- 3107 Barry Trace Ct Unit 3107
- 3138 Kingsmead Trace Unit 3138
- 3112 Barry Trace Ct
- 3110 Barry Trace Ct
- 3106 Kingsmead Trace
- 3140 Kingsmead Trace Unit 3140
Your Personal Tour Guide
Ask me questions while you tour the home.