J
Seller's Agent in 2025
Julie Bovard
Prodigy Properties
(513) 841-7012
120 Total Sales
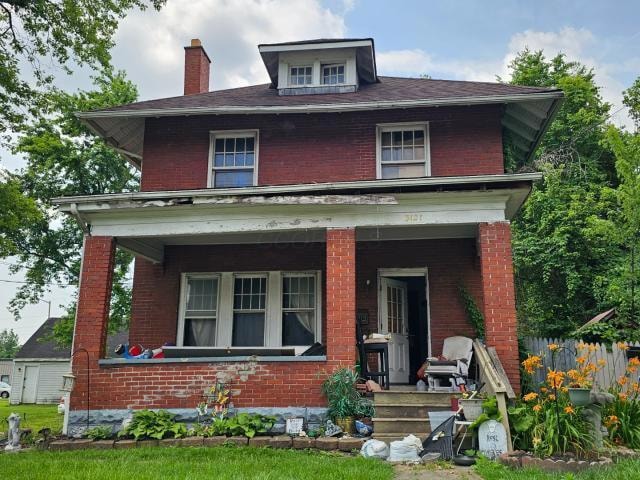

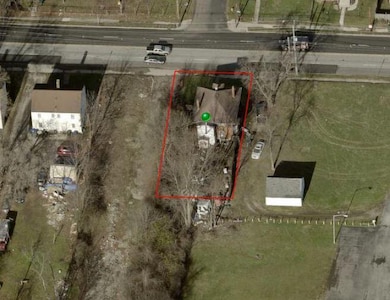
Court Ordered Sale by Private Selling Officer. All information we have on the property is included. We have no additional information, property condition is unknown. NO SHOWINGS, NO trespassing for any reason. Auction ends July 24, 2025 & is online only. Information is thought to be correct but not guaranteed. 10% Buyer Premium added to the high bid, $5,000 deposit is due within 24 hours of bidding end.
Last Agent to Sell the Property
Prodigy Properties License #2001021921 Listed on: 07/24/2025
Last Buyer's Agent
NON MEMBER
NON MEMBER OFFICE
| Date | Type | Sale Price | Title Company |
|---|---|---|---|
| Warranty Deed | $95,000 | Stewart Title Company | |
| Sheriffs Deed | $62,590 | Standard Title | |
| Warranty Deed | $26,150 | Contract Processing & Title | |
| Sheriffs Deed | $36,600 | -- | |
| Deed | $62,500 | -- | |
| Deed | $35,500 | -- | |
| Deed | $13,400 | -- |
| Date | Status | Loan Amount | Loan Type |
|---|---|---|---|
| Open | $152,000 | Construction | |
| Previous Owner | $62,350 | New Conventional |
| Date | Event | Price | List to Sale | Price per Sq Ft |
|---|---|---|---|---|
| 11/19/2025 11/19/25 | Sold | $62,590 | 0.0% | $37 / Sq Ft |
| 07/24/2025 07/24/25 | Pending | -- | -- | -- |
| 07/16/2025 07/16/25 | Off Market | $62,590 | -- | -- |
| 07/16/2025 07/16/25 | For Sale | $1 | -- | $0 / Sq Ft |
| Year | Tax Paid | Tax Assessment Tax Assessment Total Assessment is a certain percentage of the fair market value that is determined by local assessors to be the total taxable value of land and additions on the property. | Land | Improvement |
|---|---|---|---|---|
| 2025 | $7,276 | $63,320 | $10,260 | $53,060 |
| 2024 | $7,276 | $63,320 | $10,260 | $53,060 |
| 2023 | $4,808 | $63,320 | $10,260 | $53,060 |
| 2022 | $3,029 | $19,950 | $2,100 | $17,850 |
| 2021 | $1,470 | $19,950 | $2,100 | $17,850 |
| 2020 | $1,184 | $19,950 | $2,100 | $17,850 |
| 2019 | $1,335 | $17,860 | $1,930 | $15,930 |
| 2018 | $1,032 | $17,860 | $1,930 | $15,930 |
| 2017 | $1,142 | $17,860 | $1,930 | $15,930 |
| 2016 | $1,156 | $16,350 | $2,490 | $13,860 |
| 2015 | $983 | $16,350 | $2,490 | $13,860 |
| 2014 | $986 | $16,350 | $2,490 | $13,860 |
| 2013 | $572 | $19,250 | $2,940 | $16,310 |
J
Seller's Agent in 2025
Julie Bovard
Prodigy Properties
(513) 841-7012
120 Total Sales
N
Buyer's Agent in 2025
NON MEMBER
NON MEMBER OFFICE
Source: Columbus and Central Ohio Regional MLS
MLS Number: 225026253
APN: 010-066379
Disclaimer: Certain information contained herein is derived from information provided by parties other than Homes.com. All information provided is deemed reliable, but is not guaranteed to be accurate and should be independently verified.
![]() IDX information is provided exclusively for personal, non-commercial use, and may not be used for any purpose other than to identify prospective properties consumers may be interested in purchasing.
IDX information is provided exclusively for personal, non-commercial use, and may not be used for any purpose other than to identify prospective properties consumers may be interested in purchasing.
Information is deemed reliable but not guaranteed.
Ask me questions while you tour the home.
