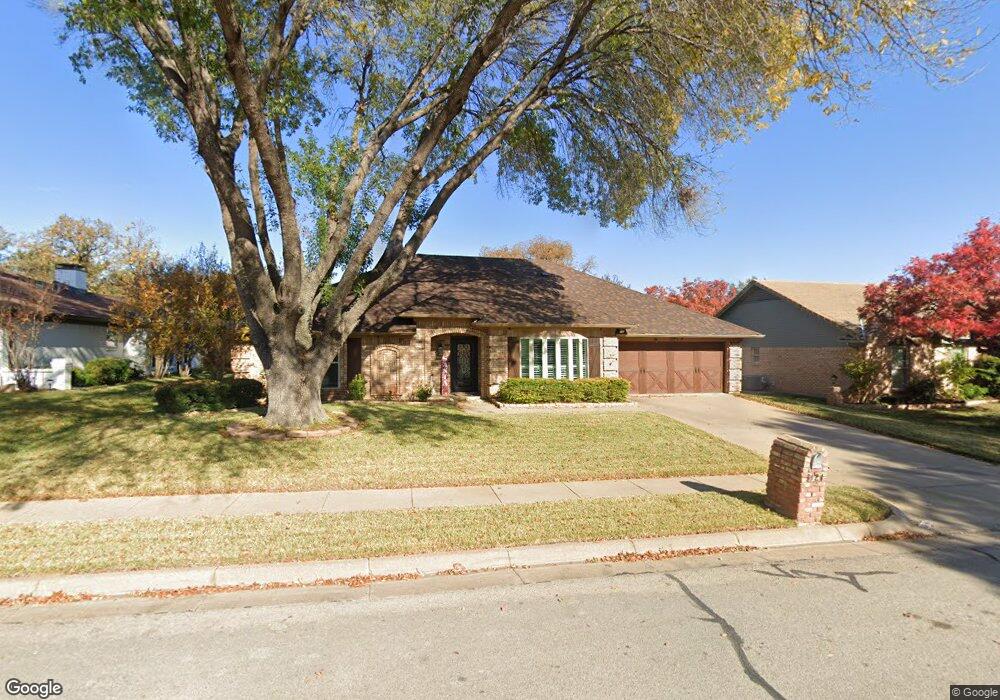
3121 Shenandoah Dr Bedford, TX 76021
Estimated Value: $456,259 - $469,000
4
Beds
2
Baths
2,098
Sq Ft
$220/Sq Ft
Est. Value
About This Home
This home is located at 3121 Shenandoah Dr, Bedford, TX 76021 and is currently estimated at $461,565, approximately $220 per square foot. 3121 Shenandoah Dr is a home located in Tarrant County with nearby schools including Bedford Heights Elementary School, Bedford Junior High School, and L.D. Bell High School.
Ownership History
Date
Name
Owned For
Owner Type
Purchase Details
Closed on
Dec 8, 2017
Sold by
Jones Donald E and Jones Doris L
Bought by
Rodriguez Feliper R and Rodriguez Karina A
Current Estimated Value
Home Financials for this Owner
Home Financials are based on the most recent Mortgage that was taken out on this home.
Original Mortgage
$222,000
Outstanding Balance
$186,905
Interest Rate
3.94%
Mortgage Type
New Conventional
Estimated Equity
$274,660
Create a Home Valuation Report for This Property
The Home Valuation Report is an in-depth analysis detailing your home's value as well as a comparison with similar homes in the area
Home Values in the Area
Average Home Value in this Area
Purchase History
| Date | Buyer | Sale Price | Title Company |
|---|---|---|---|
| Rodriguez Feliper R | -- | None Available |
Source: Public Records
Mortgage History
| Date | Status | Borrower | Loan Amount |
|---|---|---|---|
| Open | Rodriguez Feliper R | $222,000 |
Source: Public Records
Tax History Compared to Growth
Tax History
| Year | Tax Paid | Tax Assessment Tax Assessment Total Assessment is a certain percentage of the fair market value that is determined by local assessors to be the total taxable value of land and additions on the property. | Land | Improvement |
|---|---|---|---|---|
| 2025 | $7,232 | $407,000 | $75,000 | $332,000 |
| 2024 | $7,232 | $451,716 | $75,000 | $376,716 |
| 2023 | $7,685 | $434,003 | $55,000 | $379,003 |
| 2022 | $7,956 | $372,961 | $55,000 | $317,961 |
| 2021 | $7,800 | $331,142 | $55,000 | $276,142 |
| 2020 | $7,489 | $315,000 | $55,000 | $260,000 |
| 2019 | $7,383 | $315,000 | $55,000 | $260,000 |
| 2018 | $6,330 | $276,280 | $55,000 | $221,280 |
| 2017 | $5,908 | $244,239 | $18,000 | $226,239 |
| 2016 | $5,546 | $231,039 | $18,000 | $213,039 |
| 2015 | $4,958 | $208,400 | $18,000 | $190,400 |
| 2014 | $4,958 | $208,400 | $18,000 | $190,400 |
Source: Public Records
Map
Nearby Homes
- 320 Blue Quail Ct
- 305 Warbler Dr
- 405 Woodbriar Ct
- 432 Sunnybrook Ct
- 404 Heather Ln
- 3213 Spring Valley Dr
- 3119 Spring Grove Dr
- 3713 Brentwood Ct
- 3605 Spring Valley Dr
- 2212 Hurstview Dr
- 2244 Hurstview Dr
- 421 Cavender Ct
- 121 Kay Ct
- 124 Jeannie Ct
- 801 Shady Creek Ln
- 2620 Brookridge Dr
- 1732 Jeannie Ln
- 913 Kensington Ct
- 628 Huntwich Dr
- 817 Shady Lake Dr
- 3117 Shenandoah Dr
- 3125 Shenandoah Dr
- 220 Pheasant Ct
- 3233 Blue Quail Ln
- 216 Pheasant Ct
- 3113 Shenandoah Dr
- 3120 Shenandoah Dr
- 3124 Shenandoah Dr
- 3116 Shenandoah Dr
- 212 Pheasant Ct
- 301 Shenandoah Ct
- 3109 Shenandoah Dr
- 3040 Shenandoah Dr
- 300 Blue Quail Ct
- 208 Pheasant Ct
- 300 Shenandoah Ct
- 209 Stanford Dr
- 3036 Shenandoah Dr
- 217 Pheasant Ct
- 305 Shenandoah Ct