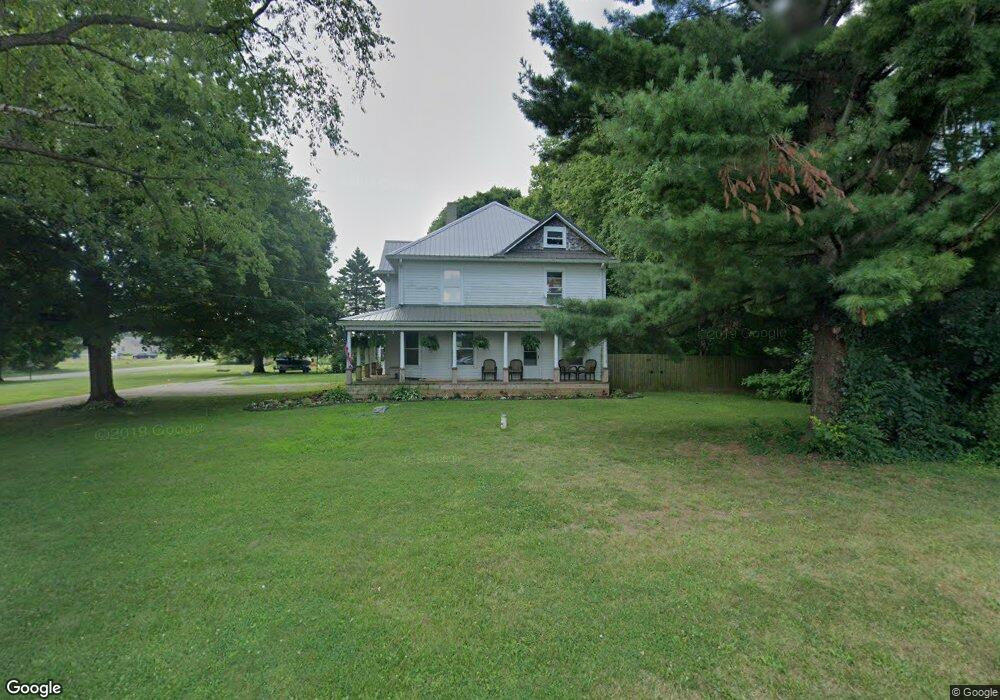
3121 Willow Rd Springfield, OH 45502
Estimated Value: $319,000 - $374,000
4
Beds
2
Baths
2,792
Sq Ft
$123/Sq Ft
Est. Value
About This Home
This home is located at 3121 Willow Rd, Springfield, OH 45502 and is currently estimated at $344,419, approximately $123 per square foot. 3121 Willow Rd is a home located in Clark County with nearby schools including Northridge Elementary School and Kenton Ridge Middle & High School.
Ownership History
Date
Name
Owned For
Owner Type
Purchase Details
Closed on
Jul 18, 2017
Sold by
Claugus Ii Thomas E and Claugus Karen L
Bought by
Fansler Darren T and Gartin Erika M
Current Estimated Value
Home Financials for this Owner
Home Financials are based on the most recent Mortgage that was taken out on this home.
Original Mortgage
$68,000
Outstanding Balance
$34,771
Interest Rate
3.91%
Mortgage Type
New Conventional
Estimated Equity
$309,648
Purchase Details
Closed on
Jul 14, 2014
Sold by
The Bank Of New York Mellon
Bought by
Claugus Ii Thomas E
Purchase Details
Closed on
Jun 26, 2014
Sold by
Mckeever Jeffery L and Mckeever Jeffrey L
Bought by
The Bank Of New York Mellon and The Bank Of New York
Purchase Details
Closed on
Jun 17, 2004
Sold by
See Karol K
Bought by
Mckeever Jeffery L and Klay Jane A
Home Financials for this Owner
Home Financials are based on the most recent Mortgage that was taken out on this home.
Original Mortgage
$112,000
Interest Rate
6.17%
Mortgage Type
Purchase Money Mortgage
Create a Home Valuation Report for This Property
The Home Valuation Report is an in-depth analysis detailing your home's value as well as a comparison with similar homes in the area
Home Values in the Area
Average Home Value in this Area
Purchase History
| Date | Buyer | Sale Price | Title Company |
|---|---|---|---|
| Fansler Darren T | $85,000 | None Available | |
| Claugus Ii Thomas E | $62,100 | Attorney | |
| The Bank Of New York Mellon | $140,250 | None Available | |
| Mckeever Jeffery L | $140,000 | -- |
Source: Public Records
Mortgage History
| Date | Status | Borrower | Loan Amount |
|---|---|---|---|
| Open | Fansler Darren T | $68,000 | |
| Previous Owner | Mckeever Jeffery L | $112,000 | |
| Closed | Mckeever Jeffery L | $28,000 |
Source: Public Records
Tax History
| Year | Tax Paid | Tax Assessment Tax Assessment Total Assessment is a certain percentage of the fair market value that is determined by local assessors to be the total taxable value of land and additions on the property. | Land | Improvement |
|---|---|---|---|---|
| 2025 | $3,120 | $87,240 | $19,770 | $67,470 |
| 2024 | $3,017 | $71,250 | $14,480 | $56,770 |
| 2023 | $3,018 | $71,250 | $14,480 | $56,770 |
| 2022 | $2,938 | $71,250 | $14,480 | $56,770 |
| 2021 | $2,938 | $58,580 | $11,870 | $46,710 |
| 2020 | $2,941 | $58,580 | $11,870 | $46,710 |
| 2019 | $2,997 | $58,580 | $11,870 | $46,710 |
| 2018 | $2,618 | $49,110 | $10,960 | $38,150 |
| 2017 | $2,227 | $47,506 | $10,955 | $36,551 |
| 2016 | $2,196 | $47,156 | $10,955 | $36,201 |
| 2015 | $2,125 | $43,960 | $10,955 | $33,005 |
| 2014 | $2,072 | $43,960 | $10,955 | $33,005 |
| 2013 | $2,928 | $43,960 | $10,955 | $33,005 |
Source: Public Records
Map
Nearby Homes
- 2939 Willow Rd
- 5060 Morris Rd
- 4273 Kay Ave
- 6360 Renee St
- 1836 Dunseth Ln
- 1812 Willow Lakes Dr
- 5670 Prairie Rd
- 1707 Berwick Dr
- 4293 Yale St
- 1470 Oldham Dr Unit 12
- 5564 Ridgewood Rd E Unit 7
- 4500 Bosart Rd
- 5722 Victorian Way Unit 31
- 1521 Erika Dr
- 1709 Thomas Dr
- 5564 Ridgewood Rd W
- 5033 Ridgewood Rd E
- 4652 Reno Ln Unit 15
- 937 Willow Rd
- 9 Middle Urbana Rd
- 3107 Willow Rd
- 3183 Willow Rd
- 3120 Willow Rd
- 2711 Windy Ridge Dr
- 3075 Willow Rd
- 3110 Willow Rd
- 3140 Willow Rd
- 3070 Willow Rd
- 3211 Willow Rd
- 3210 Willow Rd
- 3047 Willow Rd
- 3066 Aubree Ln
- 2710 Windy Ridge Dr
- 3220 Willow Rd
- 3048 Aubree Ln
- 3239 Willow Rd
- 2742 Windy Ridge Dr
- 3040 Willow Rd
- 2757 Windy Ridge Dr
- 6158 Harvest St
Your Personal Tour Guide
Ask me questions while you tour the home.