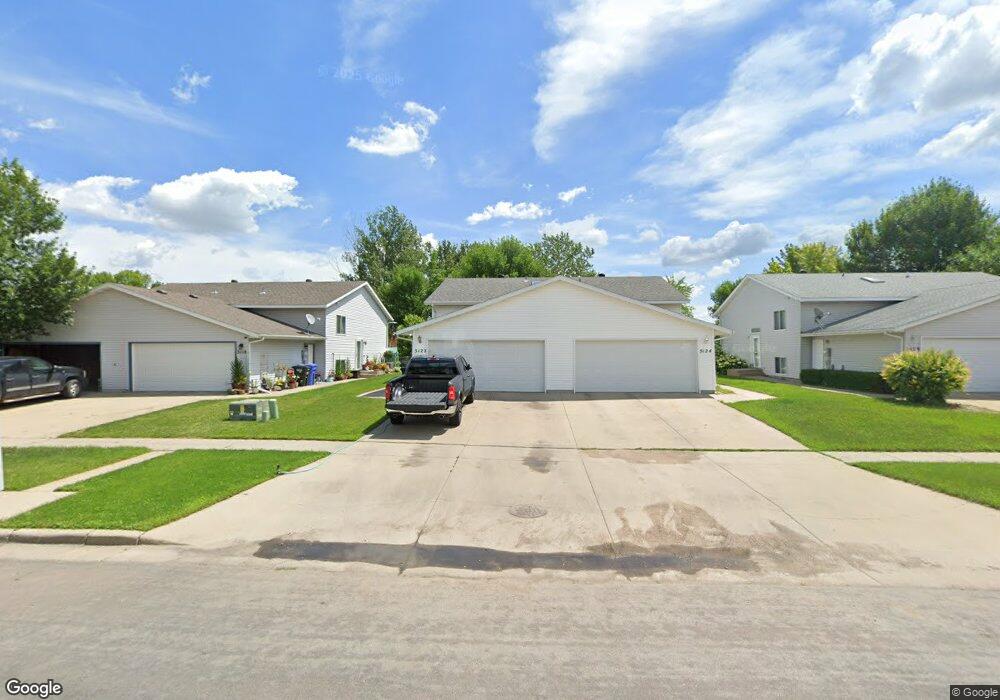
3122 17th St S Fargo, ND 58103
Brunsdale NeighborhoodEstimated Value: $239,000 - $264,000
3
Beds
2
Baths
1,600
Sq Ft
$159/Sq Ft
Est. Value
About This Home
This home is located at 3122 17th St S, Fargo, ND 58103 and is currently estimated at $253,872, approximately $158 per square foot. 3122 17th St S is a home located in Cass County with nearby schools including Lincoln Elementary School, Carl Ben Eielson Middle School, and South High School.
Ownership History
Date
Name
Owned For
Owner Type
Purchase Details
Closed on
Dec 3, 2015
Sold by
Shawn Brian A and Shawn Jessica
Bought by
Davidson Shayne
Current Estimated Value
Home Financials for this Owner
Home Financials are based on the most recent Mortgage that was taken out on this home.
Original Mortgage
$132,000
Outstanding Balance
$104,075
Interest Rate
3.78%
Mortgage Type
New Conventional
Estimated Equity
$149,797
Purchase Details
Closed on
Sep 26, 2008
Sold by
Frappier Kate E and Frappier Kate L E
Bought by
Shawn Brian A
Home Financials for this Owner
Home Financials are based on the most recent Mortgage that was taken out on this home.
Original Mortgage
$129,652
Interest Rate
6.57%
Mortgage Type
FHA
Purchase Details
Closed on
May 19, 2006
Sold by
West Brenda J and Dusek Jeffrey J
Bought by
Frappier Kate L E
Home Financials for this Owner
Home Financials are based on the most recent Mortgage that was taken out on this home.
Original Mortgage
$121,099
Interest Rate
6.1%
Mortgage Type
FHA
Create a Home Valuation Report for This Property
The Home Valuation Report is an in-depth analysis detailing your home's value as well as a comparison with similar homes in the area
Home Values in the Area
Average Home Value in this Area
Purchase History
| Date | Buyer | Sale Price | Title Company |
|---|---|---|---|
| Davidson Shayne | $165,000 | None Available | |
| Shawn Brian A | -- | -- | |
| Frappier Kate L E | $123,000 | -- |
Source: Public Records
Mortgage History
| Date | Status | Borrower | Loan Amount |
|---|---|---|---|
| Open | Davidson Shayne | $132,000 | |
| Previous Owner | Shawn Brian A | $129,652 | |
| Previous Owner | Frappier Kate L E | $121,099 |
Source: Public Records
Tax History Compared to Growth
Tax History
| Year | Tax Paid | Tax Assessment Tax Assessment Total Assessment is a certain percentage of the fair market value that is determined by local assessors to be the total taxable value of land and additions on the property. | Land | Improvement |
|---|---|---|---|---|
| 2024 | $2,663 | $115,950 | $21,100 | $94,850 |
| 2023 | $3,000 | $110,450 | $21,100 | $89,350 |
| 2022 | $2,658 | $96,050 | $21,100 | $74,950 |
| 2021 | $2,545 | $93,600 | $15,050 | $78,550 |
| 2020 | $2,440 | $90,850 | $15,050 | $75,800 |
| 2019 | $2,328 | $86,500 | $8,350 | $78,150 |
| 2018 | $2,298 | $86,500 | $8,350 | $78,150 |
| 2017 | $2,117 | $82,400 | $8,350 | $74,050 |
| 2016 | $1,885 | $80,000 | $8,350 | $71,650 |
| 2015 | $1,551 | $61,700 | $6,250 | $55,450 |
| 2014 | $1,473 | $57,150 | $6,250 | $50,900 |
| 2013 | $1,474 | $57,150 | $6,250 | $50,900 |
Source: Public Records
Map
Nearby Homes
- 3124 17th St S
- 3118 17th St S
- 3128 17th St S
- 3116 17th St S
- 3112 17th St S
- 3130 17th St S
- 3110 17th St S
- 1628 31st Ave S
- 1632 31st Ave S
- 1626 31st Ave S
- 1634 31st Ave S
- 1638 31st Ave S
- 1620 31st Ave S
- 3165 17th St S
- 3165 17th St S
- 3165 17th St S Unit E
- 3165 17th St S Unit D
- 3165 17th St S Unit C
- 3165 17th St S Unit B
- 3165 17th St S Unit A