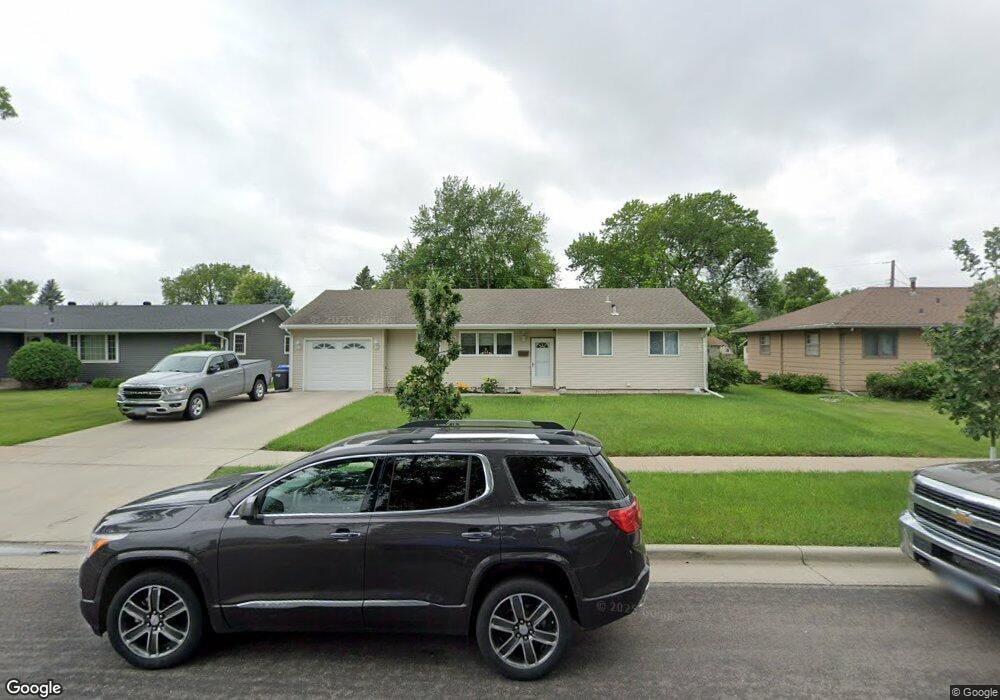
3122 7th St N Fargo, ND 58102
Northport NeighborhoodEstimated Value: $249,000 - $271,173
3
Beds
2
Baths
1,070
Sq Ft
$247/Sq Ft
Est. Value
About This Home
This home is located at 3122 7th St N, Fargo, ND 58102 and is currently estimated at $264,793, approximately $247 per square foot. 3122 7th St N is a home located in Cass County with nearby schools including McKinley Elementary School, Ben Franklin Middle School, and North High School.
Ownership History
Date
Name
Owned For
Owner Type
Purchase Details
Closed on
Jul 11, 2013
Sold by
Hoff Garrett G and Hoff Linda R
Bought by
Rooks Joshua A and Rooks Jennifer J
Current Estimated Value
Home Financials for this Owner
Home Financials are based on the most recent Mortgage that was taken out on this home.
Original Mortgage
$139,650
Outstanding Balance
$101,159
Interest Rate
3.83%
Mortgage Type
New Conventional
Estimated Equity
$163,634
Purchase Details
Closed on
May 18, 2006
Sold by
Mcintyre Patrick L and Mcintyre Katherine I
Bought by
Hoff Garrett G and Hoff Linda R
Home Financials for this Owner
Home Financials are based on the most recent Mortgage that was taken out on this home.
Original Mortgage
$115,710
Interest Rate
5.55%
Mortgage Type
FHA
Create a Home Valuation Report for This Property
The Home Valuation Report is an in-depth analysis detailing your home's value as well as a comparison with similar homes in the area
Home Values in the Area
Average Home Value in this Area
Purchase History
| Date | Buyer | Sale Price | Title Company |
|---|---|---|---|
| Rooks Joshua A | $147,000 | None Available | |
| Hoff Garrett G | $126,000 | -- |
Source: Public Records
Mortgage History
| Date | Status | Borrower | Loan Amount |
|---|---|---|---|
| Open | Rooks Joshua A | $139,650 | |
| Previous Owner | Hoff Garrett G | $115,710 |
Source: Public Records
Tax History Compared to Growth
Tax History
| Year | Tax Paid | Tax Assessment Tax Assessment Total Assessment is a certain percentage of the fair market value that is determined by local assessors to be the total taxable value of land and additions on the property. | Land | Improvement |
|---|---|---|---|---|
| 2024 | $3,489 | $121,800 | $29,950 | $91,850 |
| 2023 | $3,765 | $114,900 | $29,950 | $84,950 |
| 2022 | $3,652 | $108,400 | $29,950 | $78,450 |
| 2021 | $3,435 | $102,250 | $29,950 | $72,300 |
| 2020 | $3,223 | $95,550 | $29,950 | $65,600 |
| 2019 | $3,226 | $95,550 | $16,650 | $78,900 |
| 2018 | $3,403 | $100,350 | $16,650 | $83,700 |
| 2017 | $2,687 | $97,450 | $16,650 | $80,800 |
| 2016 | $2,234 | $88,600 | $16,650 | $71,950 |
| 2015 | $2,374 | $88,600 | $12,500 | $76,100 |
| 2014 | $1,995 | $71,600 | $12,500 | $59,100 |
| 2013 | $1,821 | $68,200 | $12,500 | $55,700 |
Source: Public Records
Map
Nearby Homes
- 3129 8th St N
- 801 32nd Ave N Unit A102
- 3113 8th St N
- 501 Forest Ave N Unit C
- 3217 Cherry Ln N
- 1031 Gibraltor Ave
- 3306 2nd St N Unit D26
- 2902 3rd St N
- 2926 Edgewood Dr N
- 2937 Edgewood Dr N
- 2925 Edgewood Dr N
- 108 32nd Ave N
- 2807 Edgewood Dr N
- 310 27th Ave N
- 2510 10th St N
- 3531 1st St N
- 418 25th Ave N
- 21 35th Ave NE
- 87 28th Ave N
- 101 27th Ave N