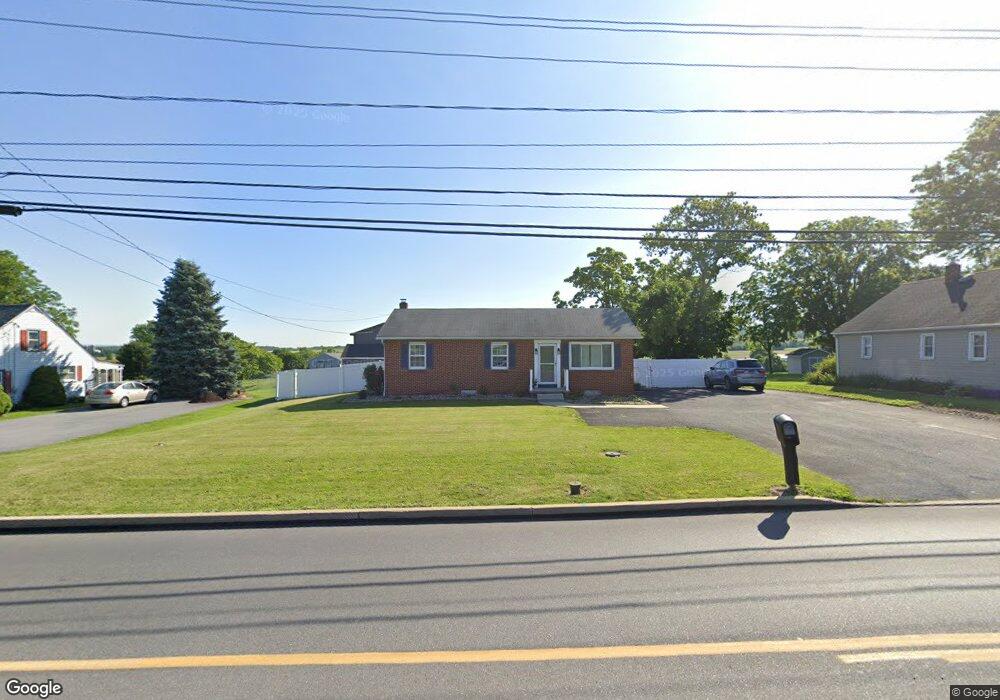
3122 Black Gap Rd Chambersburg, PA 17202
Estimated Value: $227,000 - $273,516
3
Beds
1
Bath
1,025
Sq Ft
$253/Sq Ft
Est. Value
About This Home
This home is located at 3122 Black Gap Rd, Chambersburg, PA 17202 and is currently estimated at $259,629, approximately $253 per square foot. 3122 Black Gap Rd is a home located in Franklin County with nearby schools including Chambersburg Area Middle School - North, Chambersburg Area Senior High School, and Montessori Academy of Chambersburg.
Ownership History
Date
Name
Owned For
Owner Type
Purchase Details
Closed on
Apr 14, 2025
Sold by
Shatzer Amber and Shatzer Denver
Bought by
Rice Jacob A and Mixell Cheyanne F
Current Estimated Value
Home Financials for this Owner
Home Financials are based on the most recent Mortgage that was taken out on this home.
Original Mortgage
$236,600
Outstanding Balance
$235,572
Interest Rate
6.76%
Mortgage Type
New Conventional
Estimated Equity
$24,057
Purchase Details
Closed on
Aug 31, 2018
Sold by
Martin Robert Lowell
Bought by
Katavitch Amber and Shatzer Denver
Home Financials for this Owner
Home Financials are based on the most recent Mortgage that was taken out on this home.
Original Mortgage
$140,404
Interest Rate
4.5%
Mortgage Type
New Conventional
Purchase Details
Closed on
Apr 24, 2018
Sold by
Wells Fargo Bank Na
Bought by
Martin Robert Lowell
Purchase Details
Closed on
Mar 20, 2018
Sold by
Shaffer Omar Ray and Shaffer Ida A
Bought by
Wells Fargo Bank Na
Create a Home Valuation Report for This Property
The Home Valuation Report is an in-depth analysis detailing your home's value as well as a comparison with similar homes in the area
Home Values in the Area
Average Home Value in this Area
Purchase History
| Date | Buyer | Sale Price | Title Company |
|---|---|---|---|
| Rice Jacob A | $265,000 | None Listed On Document | |
| Katavitch Amber | $139,000 | None Available | |
| Martin Robert Lowell | $84,055 | Boston Natl Title Agency Llc | |
| Wells Fargo Bank Na | $652 | None Available |
Source: Public Records
Mortgage History
| Date | Status | Borrower | Loan Amount |
|---|---|---|---|
| Open | Rice Jacob A | $236,600 | |
| Previous Owner | Katavitch Amber | $140,404 |
Source: Public Records
Tax History Compared to Growth
Tax History
| Year | Tax Paid | Tax Assessment Tax Assessment Total Assessment is a certain percentage of the fair market value that is determined by local assessors to be the total taxable value of land and additions on the property. | Land | Improvement |
|---|---|---|---|---|
| 2025 | $2,787 | $17,110 | $1,100 | $16,010 |
| 2024 | $2,700 | $17,110 | $1,100 | $16,010 |
| 2023 | $2,616 | $17,110 | $1,100 | $16,010 |
| 2022 | $2,555 | $17,110 | $1,100 | $16,010 |
| 2021 | $2,016 | $13,500 | $1,100 | $12,400 |
| 2020 | $1,963 | $13,500 | $1,100 | $12,400 |
| 2019 | $1,768 | $12,650 | $1,100 | $11,550 |
| 2018 | $1,703 | $12,650 | $1,100 | $11,550 |
| 2017 | $1,645 | $12,650 | $1,100 | $11,550 |
| 2016 | $362 | $12,650 | $1,100 | $11,550 |
| 2015 | $338 | $12,650 | $1,100 | $11,550 |
| 2014 | $338 | $12,650 | $1,100 | $11,550 |
Source: Public Records
Map
Nearby Homes
- 3052 Sundown Dr
- 3056 Sundown Dr
- 177 Granny Smith Ln
- 2103 Smoketown Rd
- 2944 Constellation Dr
- 3280 Muirfield Dr
- 3546 White Church Rd
- 3325 Muirfield Dr
- 3596A Eagle Dr
- 3271 Saint Andrews Dr
- 3398 Braemar Ct
- 3576 Fox Hill Dr
- 3581 Carnoustie Dr
- 3158 Saint Andrews Dr
- 3526 Turnberry Dr
- 3512 Fox Hill Dr
- 3534 Turnberry Dr
- 3542 Turnberry Dr
- 4470 Scotland Main St
- 1090 Ragged Edge Rd
- 3116 Black Gap Rd
- 3096 Black Gap Rd
- 3132 Black Gap Rd
- 3144 Black Gap Rd
- 3156 Black Gap Rd
- 3346 Interchange Dr
- 3384 Interchange Dr
- 3426 Interchange Dr
- 3181 Black Gap Rd
- 3188 Black Gap Rd
- 3464 Interchange Dr
- 3353 Interchange Dr
- 3427 Interchange Dr
- 3506 Interchange Dr
- 3492 Interchange Dr
- 1600 Fairview Ave
- 3204 Black Gap Rd
- 1605 Fairview Ave
- 3514 Interchange Dr
- 3503 Interchange Dr