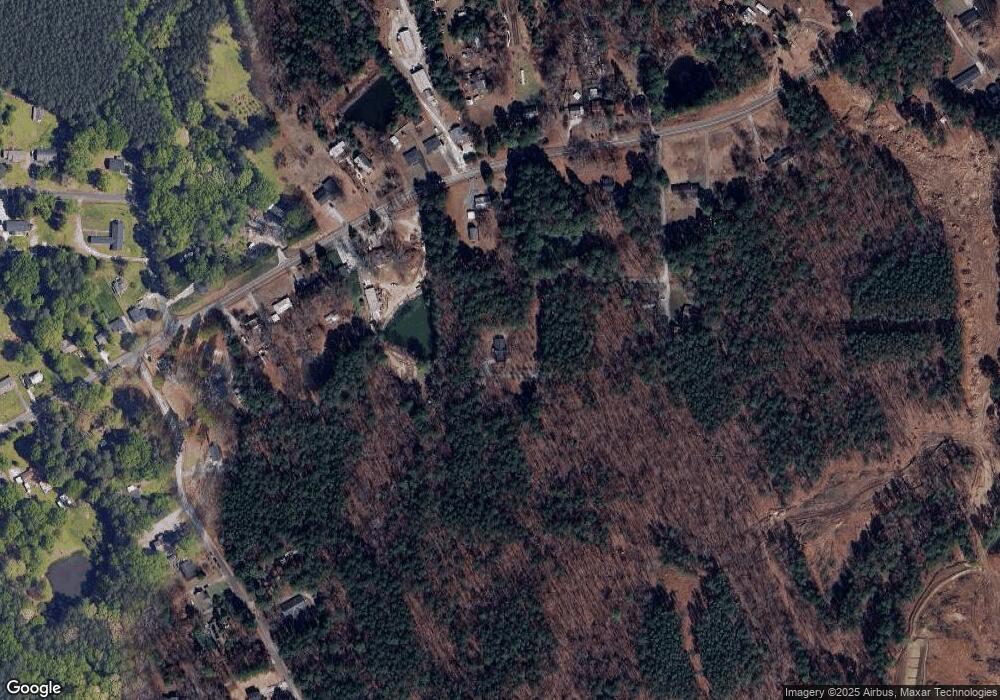
3122 Cheek Rd Durham, NC 27704
Eastern Durham NeighborhoodEstimated Value: $333,000 - $540,476
4
Beds
2
Baths
1,756
Sq Ft
$241/Sq Ft
Est. Value
About This Home
This home is located at 3122 Cheek Rd, Durham, NC 27704 and is currently estimated at $422,369, approximately $240 per square foot. 3122 Cheek Rd is a home located in Durham County with nearby schools including Glenn Elementary, John W Neal Middle School, and Southern School of Energy & Sustainability.
Ownership History
Date
Name
Owned For
Owner Type
Purchase Details
Closed on
Apr 20, 2022
Sold by
Clark Charles E and Clark Rhonda H
Bought by
Clark Barry Wayne and Clark Katherine Eddins
Current Estimated Value
Purchase Details
Closed on
Aug 25, 2000
Sold by
Clark Robin Brooks
Bought by
Clark Barry Wayne
Home Financials for this Owner
Home Financials are based on the most recent Mortgage that was taken out on this home.
Original Mortgage
$82,000
Interest Rate
8.24%
Create a Home Valuation Report for This Property
The Home Valuation Report is an in-depth analysis detailing your home's value as well as a comparison with similar homes in the area
Home Values in the Area
Average Home Value in this Area
Purchase History
| Date | Buyer | Sale Price | Title Company |
|---|---|---|---|
| Clark Barry Wayne | -- | None Listed On Document | |
| Clark Barry Wayne | -- | None Listed On Document | |
| Clark Barry Wayne | -- | -- |
Source: Public Records
Mortgage History
| Date | Status | Borrower | Loan Amount |
|---|---|---|---|
| Previous Owner | Clark Barry Wayne | $82,000 |
Source: Public Records
Tax History
| Year | Tax Paid | Tax Assessment Tax Assessment Total Assessment is a certain percentage of the fair market value that is determined by local assessors to be the total taxable value of land and additions on the property. | Land | Improvement |
|---|---|---|---|---|
| 2025 | $3,553 | $493,129 | $226,560 | $266,569 |
| 2024 | $2,240 | $206,296 | $67,162 | $139,134 |
| 2023 | $2,102 | $196,317 | $57,183 | $139,134 |
| 2022 | $1,919 | $196,317 | $57,183 | $139,134 |
| 2021 | $1,819 | $215,374 | $76,240 | $139,134 |
| 2020 | $1,798 | $215,374 | $76,240 | $139,134 |
| 2019 | $1,798 | $215,374 | $76,240 | $139,134 |
| 2018 | $1,885 | $206,575 | $82,480 | $124,095 |
| 2017 | $1,864 | $206,575 | $82,480 | $124,095 |
| 2016 | $1,807 | $206,575 | $82,480 | $124,095 |
| 2015 | $1,752 | $171,552 | $59,287 | $112,265 |
| 2014 | $1,737 | $171,552 | $59,287 | $112,265 |
Source: Public Records
Map
Nearby Homes
Your Personal Tour Guide
Ask me questions while you tour the home.