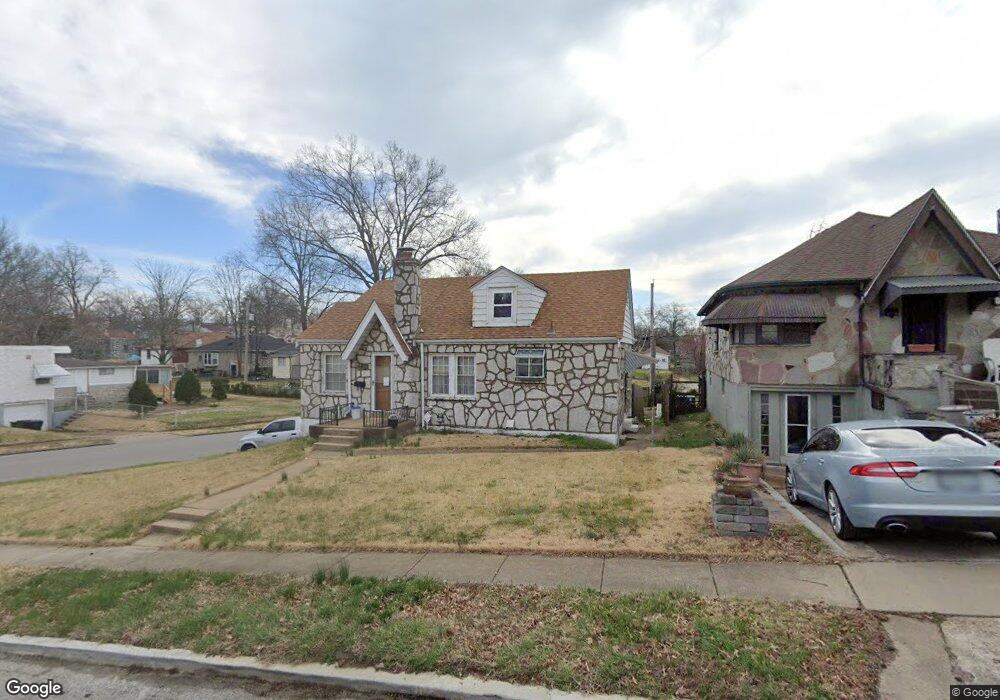
3122 Kemp Dr Saint Louis, MO 63121
Estimated Value: $65,000 - $91,000
2
Beds
1
Bath
950
Sq Ft
$82/Sq Ft
Est. Value
About This Home
This home is located at 3122 Kemp Dr, Saint Louis, MO 63121 and is currently estimated at $78,035, approximately $82 per square foot. 3122 Kemp Dr is a home located in St. Louis County with nearby schools including Normandy High School and St. Ann Catholic School.
Ownership History
Date
Name
Owned For
Owner Type
Purchase Details
Closed on
Jun 11, 2011
Sold by
Scott Marynard O and Scott Maynard
Bought by
Scottt Maynard O and Scott Maynard O
Current Estimated Value
Purchase Details
Closed on
May 8, 2003
Sold by
Real Estate Investment & Development Llc
Bought by
Scott Maynard
Purchase Details
Closed on
Mar 18, 2003
Sold by
Norwest Bank Minnesota Na
Bought by
Real Estate Investment & Development Llc
Purchase Details
Closed on
Aug 16, 2002
Sold by
Chandler Deavrah M
Bought by
Norwest Bank Minnesota Na and Southern Pacific Secured Assets Corp
Purchase Details
Closed on
Apr 6, 1997
Sold by
Wesley T Kozeny Trustee Corp
Bought by
Commercial Credit Plan Inc
Purchase Details
Closed on
Feb 19, 1997
Sold by
Mcgruder Bennie L
Bought by
Chandler Deavrah M
Purchase Details
Closed on
Dec 11, 1996
Sold by
Mcgruder Deborah A
Bought by
Mcgruder Bennie L
Create a Home Valuation Report for This Property
The Home Valuation Report is an in-depth analysis detailing your home's value as well as a comparison with similar homes in the area
Home Values in the Area
Average Home Value in this Area
Purchase History
| Date | Buyer | Sale Price | Title Company |
|---|---|---|---|
| Scottt Maynard O | -- | None Available | |
| Scott Maynard | $33,000 | -- | |
| Real Estate Investment & Development Llc | $25,000 | -- | |
| Norwest Bank Minnesota Na | $31,073 | -- | |
| Commercial Credit Plan Inc | $11,342 | -- | |
| Chandler Deavrah M | -- | -- | |
| Mcgruder Bennie L | -- | -- | |
| Mcgruder Bennie L | -- | -- |
Source: Public Records
Mortgage History
| Date | Status | Borrower | Loan Amount |
|---|---|---|---|
| Closed | Norwest Bank Minnesota Na | -- |
Source: Public Records
Tax History Compared to Growth
Tax History
| Year | Tax Paid | Tax Assessment Tax Assessment Total Assessment is a certain percentage of the fair market value that is determined by local assessors to be the total taxable value of land and additions on the property. | Land | Improvement |
|---|---|---|---|---|
| 2025 | $1,045 | $14,880 | $1,500 | $13,380 |
| 2024 | $1,045 | $10,940 | $380 | $10,560 |
| 2023 | $1,061 | $10,940 | $380 | $10,560 |
| 2022 | $813 | $7,110 | $740 | $6,370 |
| 2021 | $789 | $7,110 | $740 | $6,370 |
| 2020 | $794 | $7,030 | $800 | $6,230 |
| 2019 | $788 | $7,030 | $800 | $6,230 |
| 2018 | $796 | $6,670 | $820 | $5,850 |
| 2017 | $788 | $6,670 | $820 | $5,850 |
| 2016 | $733 | $5,870 | $820 | $5,050 |
| 2015 | $714 | $5,870 | $820 | $5,050 |
| 2014 | $1,023 | $8,760 | $2,050 | $6,710 |
Source: Public Records
Map
Nearby Homes
- 3217 Capehart Dr
- 3003 Gary Dr
- 6927 Myron Ave
- 3529 Belaire Place
- 3507 Colonial Ave
- 7022 Greenway Ave
- 3711 Lawler Dr
- 2912 Lincoln Ave
- 6501 Woodrow Ave
- 7105 Lexington Ave
- 7116 Edison Ave
- 6918 Normandale Dr
- 3714 Nelson Dr
- 3604 Ridgedale Ave
- 3706 Colonial Ave
- 3725 Avondale Ave
- 7134 Glenmore Ave
- 2129 Rosebud Ave
- 3731 Avondale Ave
- 3503 West Place