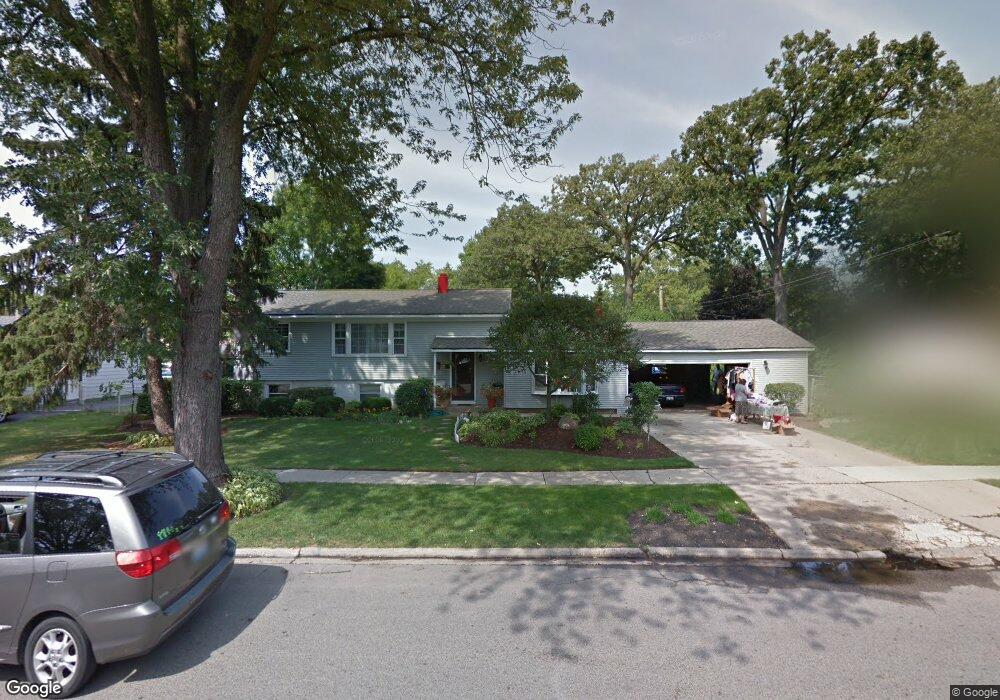
3122 Wakefield Dr Carpentersville, IL 60110
Estimated Value: $284,000 - $297,202
3
Beds
--
Bath
2,548
Sq Ft
$114/Sq Ft
Est. Value
About This Home
This home is located at 3122 Wakefield Dr, Carpentersville, IL 60110 and is currently estimated at $291,051, approximately $114 per square foot. 3122 Wakefield Dr is a home located in Kane County with nearby schools including Golfview Elementary School, Carpentersville Middle School, and Dundee-Crown High School.
Ownership History
Date
Name
Owned For
Owner Type
Purchase Details
Closed on
Apr 9, 2004
Sold by
Rico Maria Elena
Bought by
Rico Sabino and Rico Adriana
Current Estimated Value
Home Financials for this Owner
Home Financials are based on the most recent Mortgage that was taken out on this home.
Original Mortgage
$124,712
Interest Rate
5.48%
Mortgage Type
FHA
Purchase Details
Closed on
Jan 28, 2003
Sold by
Rico Sabino and Rico Sabino
Bought by
Rico Sabino and Derico Maria Elena Espinoza
Home Financials for this Owner
Home Financials are based on the most recent Mortgage that was taken out on this home.
Original Mortgage
$120,000
Interest Rate
5.94%
Mortgage Type
Purchase Money Mortgage
Purchase Details
Closed on
Jul 29, 1998
Sold by
Schalk Theodore W and Schalk Susan P
Bought by
Rico Sabino and Rico Sabino
Home Financials for this Owner
Home Financials are based on the most recent Mortgage that was taken out on this home.
Original Mortgage
$115,235
Interest Rate
7.05%
Mortgage Type
FHA
Create a Home Valuation Report for This Property
The Home Valuation Report is an in-depth analysis detailing your home's value as well as a comparison with similar homes in the area
Home Values in the Area
Average Home Value in this Area
Purchase History
| Date | Buyer | Sale Price | Title Company |
|---|---|---|---|
| Rico Sabino | -- | Chicago Title Insurance Comp | |
| Rico Sabino | -- | Ticor Title Insurance Compan | |
| Rico Sabino | $116,000 | -- |
Source: Public Records
Mortgage History
| Date | Status | Borrower | Loan Amount |
|---|---|---|---|
| Closed | Rico Sabino | $124,712 | |
| Closed | Rico Sabino | $120,000 | |
| Closed | Rico Sabino | $115,235 |
Source: Public Records
Tax History Compared to Growth
Tax History
| Year | Tax Paid | Tax Assessment Tax Assessment Total Assessment is a certain percentage of the fair market value that is determined by local assessors to be the total taxable value of land and additions on the property. | Land | Improvement |
|---|---|---|---|---|
| 2024 | $2,684 | $84,933 | $12,553 | $72,380 |
| 2023 | $2,978 | $76,420 | $11,295 | $65,125 |
| 2022 | $3,522 | $74,554 | $11,295 | $63,259 |
| 2021 | $5,380 | $70,394 | $10,665 | $59,729 |
| 2020 | $3,695 | $68,811 | $10,425 | $58,386 |
| 2019 | $3,827 | $65,323 | $9,897 | $55,426 |
| 2018 | $4,014 | $61,448 | $9,701 | $51,747 |
| 2017 | $5,281 | $57,482 | $9,075 | $48,407 |
| 2016 | $5,000 | $51,444 | $8,787 | $42,657 |
| 2015 | -- | $41,942 | $8,234 | $33,708 |
| 2014 | -- | $37,272 | $8,007 | $29,265 |
| 2013 | -- | $38,413 | $8,252 | $30,161 |
Source: Public Records
Map
Nearby Homes
- 1505 Plymouth Cir
- 1423 Windsor Cir
- 1000 Adams Ct
- 901 Garfield Dr
- 51 Golfview Ln
- 512 Tyler Dr
- 25 Rolling Hills Dr
- 7 Hickory Dr
- 2021 Berkshire Cir Unit B
- 34 Hickory Dr
- 57 Robin Rd
- 1105 Denver Dr
- 160J Bateman Rd
- 4 Austin Ave
- 7 Austin Ave
- 1415 Plainview Rd
- 225 Westfield Way
- 730 Council Hill Rd
- Lot 6B Ravine Rd
- Lot 6A Ravine Rd
- 3120 Wakefield Dr
- 7047 Lowell Dr
- 3124 Wakefield Dr
- 371 Tee Ln
- 7045 Lowell Dr
- 3118 Wakefield Dr Unit 15
- 369 Tee Ln
- 3121 Wakefield Dr
- 3123 Wakefield Dr
- 7043 Lowell Dr
- 1401 Windsor Cir
- 377 Tee Ln
- 3116 Wakefield Dr
- 7041 Lowell Dr
- 3117 Wakefield Dr
- 1402 Windsor Cir
- 367 Tee Ln
- 372 Tee Ln
- 374 Tee Ln
- 7040 Lowell Dr