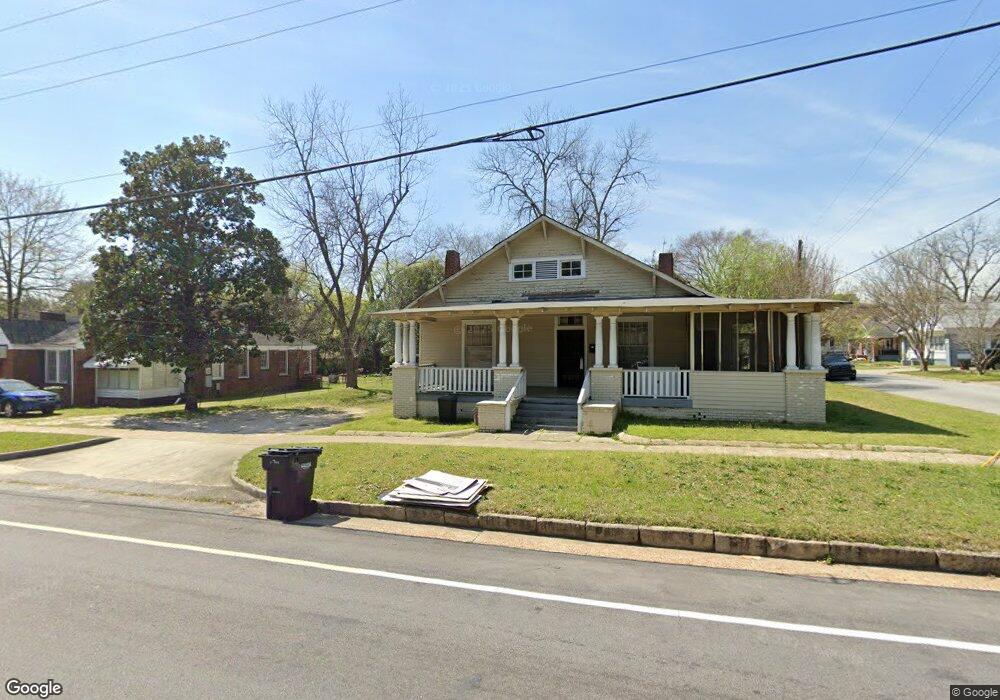
3123 12th Ave Columbus, GA 31904
Waverly Terrace NeighborhoodEstimated Value: $142,000 - $216,000
3
Beds
2
Baths
2,011
Sq Ft
$85/Sq Ft
Est. Value
About This Home
This home is located at 3123 12th Ave, Columbus, GA 31904 and is currently estimated at $170,170, approximately $84 per square foot. 3123 12th Ave is a home located in Muscogee County with nearby schools including Johnson Elementary School, Arnold Middle School, and Jordan Vocational High School.
Ownership History
Date
Name
Owned For
Owner Type
Purchase Details
Closed on
Oct 31, 2017
Sold by
Laurel Homes Llc
Bought by
Winter Garden Trading Co Llc
Current Estimated Value
Purchase Details
Closed on
Feb 24, 2014
Sold by
Deutsche Bank National Tru
Bought by
Windsor Mtg Holdings Limited L
Purchase Details
Closed on
Oct 1, 2013
Sold by
Williams Catha
Bought by
Deutsche Bank National Trust C
Create a Home Valuation Report for This Property
The Home Valuation Report is an in-depth analysis detailing your home's value as well as a comparison with similar homes in the area
Home Values in the Area
Average Home Value in this Area
Purchase History
| Date | Buyer | Sale Price | Title Company |
|---|---|---|---|
| Winter Garden Trading Co Llc | $26,805 | -- | |
| Laurel Homes Llc | $26,805 | -- | |
| Windsor Mtg Holdings Limited L | $25,200 | -- | |
| Deutsche Bank National Trust C | $39,000 | -- |
Source: Public Records
Tax History Compared to Growth
Tax History
| Year | Tax Paid | Tax Assessment Tax Assessment Total Assessment is a certain percentage of the fair market value that is determined by local assessors to be the total taxable value of land and additions on the property. | Land | Improvement |
|---|---|---|---|---|
| 2025 | $2,272 | $58,036 | $8,004 | $50,032 |
| 2024 | $2,075 | $62,360 | $8,004 | $54,356 |
| 2023 | $2,456 | $62,360 | $8,004 | $54,356 |
| 2022 | $1,936 | $47,424 | $8,004 | $39,420 |
| 2021 | $1,109 | $27,160 | $8,004 | $19,156 |
| 2020 | $1,109 | $27,160 | $8,004 | $19,156 |
| 2019 | $1,113 | $27,160 | $8,004 | $19,156 |
| 2018 | $439 | $10,720 | $1,920 | $8,800 |
| 2017 | $1,806 | $43,948 | $8,004 | $35,944 |
| 2016 | $1,160 | $28,110 | $3,833 | $24,277 |
| 2015 | $167 | $10,079 | $3,833 | $6,246 |
| 2014 | $798 | $48,239 | $3,833 | $44,406 |
| 2013 | -- | $48,239 | $3,833 | $44,406 |
Source: Public Records
Map
Nearby Homes