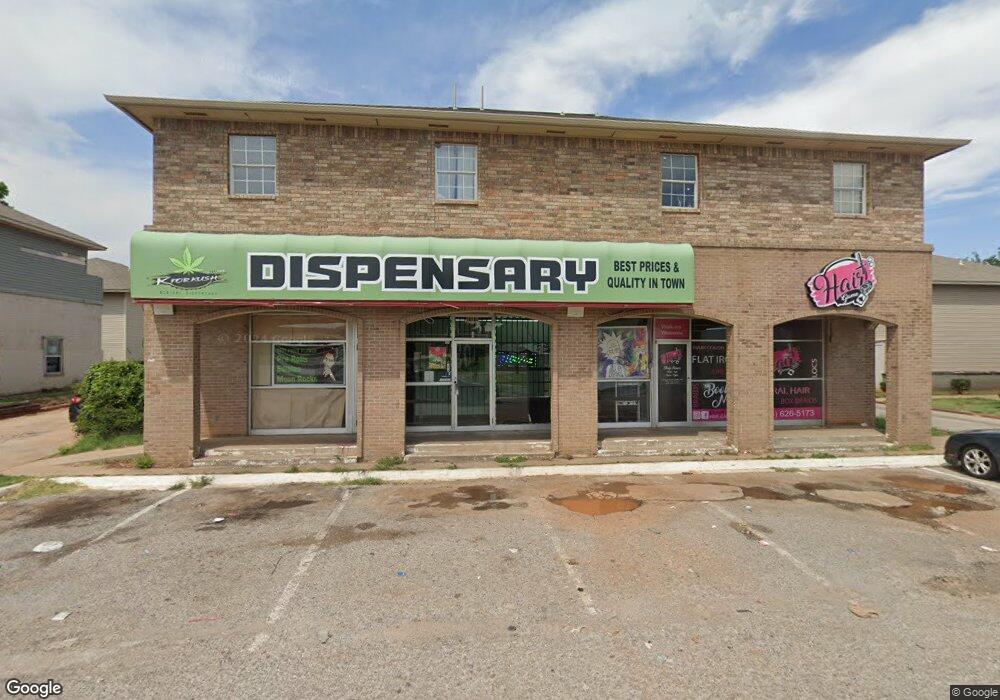
3123 N Portland Ave Unit A Oklahoma City, OK 73112
Pennington NeighborhoodEstimated Value: $940,445
--
Bed
--
Bath
5,688
Sq Ft
$165/Sq Ft
Est. Value
About This Home
This home is located at 3123 N Portland Ave Unit A, Oklahoma City, OK 73112 and is currently estimated at $940,445, approximately $165 per square foot. 3123 N Portland Ave Unit A is a home located in Oklahoma County with nearby schools including Kaiser Elementary School, Taft Middle School, and Northwest Classen High School.
Ownership History
Date
Name
Owned For
Owner Type
Purchase Details
Closed on
Aug 23, 2005
Sold by
Tran Vinh Thi and Tran Duyen Anh
Bought by
Tran Vinh Thi and Le Nancy Thi
Current Estimated Value
Purchase Details
Closed on
Oct 18, 2002
Sold by
Le John and Le Duyen Anh
Bought by
Tran Vinh Thi and Tran Duyen Anh
Home Financials for this Owner
Home Financials are based on the most recent Mortgage that was taken out on this home.
Original Mortgage
$150,000
Interest Rate
6.13%
Mortgage Type
Commercial
Purchase Details
Closed on
Oct 17, 2002
Sold by
Ho Hung
Bought by
Le John and Le Duyen Anh
Home Financials for this Owner
Home Financials are based on the most recent Mortgage that was taken out on this home.
Original Mortgage
$150,000
Interest Rate
6.13%
Mortgage Type
Commercial
Purchase Details
Closed on
Mar 2, 1999
Sold by
Alavi Seyed Mohammad Hassan and Alavi Azar
Bought by
Ho Hung
Create a Home Valuation Report for This Property
The Home Valuation Report is an in-depth analysis detailing your home's value as well as a comparison with similar homes in the area
Home Values in the Area
Average Home Value in this Area
Purchase History
| Date | Buyer | Sale Price | Title Company |
|---|---|---|---|
| Tran Vinh Thi | -- | -- | |
| Tran Vinh Thi | -- | Trustmark Title | |
| Le John | $350,000 | Trustmark Title | |
| Ho Hung | $250,000 | -- |
Source: Public Records
Mortgage History
| Date | Status | Borrower | Loan Amount |
|---|---|---|---|
| Closed | Le John | $150,000 |
Source: Public Records
Tax History Compared to Growth
Tax History
| Year | Tax Paid | Tax Assessment Tax Assessment Total Assessment is a certain percentage of the fair market value that is determined by local assessors to be the total taxable value of land and additions on the property. | Land | Improvement |
|---|---|---|---|---|
| 2024 | $6,237 | $50,784 | $5,730 | $45,054 |
| 2023 | $6,237 | $50,784 | $5,730 | $45,054 |
| 2022 | $5,974 | $50,784 | $5,730 | $45,054 |
| 2021 | $5,723 | $48,621 | $5,486 | $43,135 |
| 2020 | $5,514 | $46,306 | $5,224 | $41,082 |
| 2019 | $4,255 | $35,760 | $5,730 | $30,030 |
| 2018 | $4,057 | $35,760 | $0 | $0 |
| 2017 | $4,053 | $35,759 | $5,730 | $30,029 |
| 2016 | $4,056 | $35,759 | $5,730 | $30,029 |
| 2015 | $4,094 | $35,759 | $5,730 | $30,029 |
| 2014 | $4,071 | $35,759 | $5,730 | $30,029 |
Source: Public Records
Map
Nearby Homes
- 3817 NW 29th St
- 3229 N Nesbitt Ave
- 3205 Otterson Dr
- 3800 NW 32nd St
- 3231 Otterson Dr
- 3208 N Roff Ave
- 3838 NW 32nd St
- 3737 NW 26th St
- 3221 N Roff Ave
- 3148 Lyon Blvd
- 3709 NW 24th St
- 3509 N Nesbitt Ave
- 2804 NW 24th St
- 2807 N Lyon Blvd
- 3815 NW 23rd St
- 4045 NW 33rd St
- 3228 Cashion Place
- 3941 NW 23rd St
- 3316 NW 26th St
- 2908 N Tulsa Dr
- 3101 N Portland Ave Unit 43-201
- 3101 N Portland Ave Unit 47-204
- 3101 N Portland Ave Unit 49-203
- 3101 N Portland Ave Unit 45-103
- 3101 N Portland Ave Unit 79-102
- 3101 N Portland Ave Unit 49-201
- 3101 N Portland Ave Unit 45-201
- 3101 N Portland Ave Unit 43-108
- 3101 N Portland Ave Unit 33-103
- 3101 N Portland Ave Unit 81-103
- 3101 N Portland Ave
- 3101 N Portland Ave Unit 65-104
- 3101 N Portland Ave Unit 81-102
- 3175 N Portland Ave
- 5733 NW Oliver St
- 3728 NW Oliver St
- 3732 NW Oliver St
- 3734 NW Oliver St
- 3721 NW 31st St
- 3736 NW Oliver St