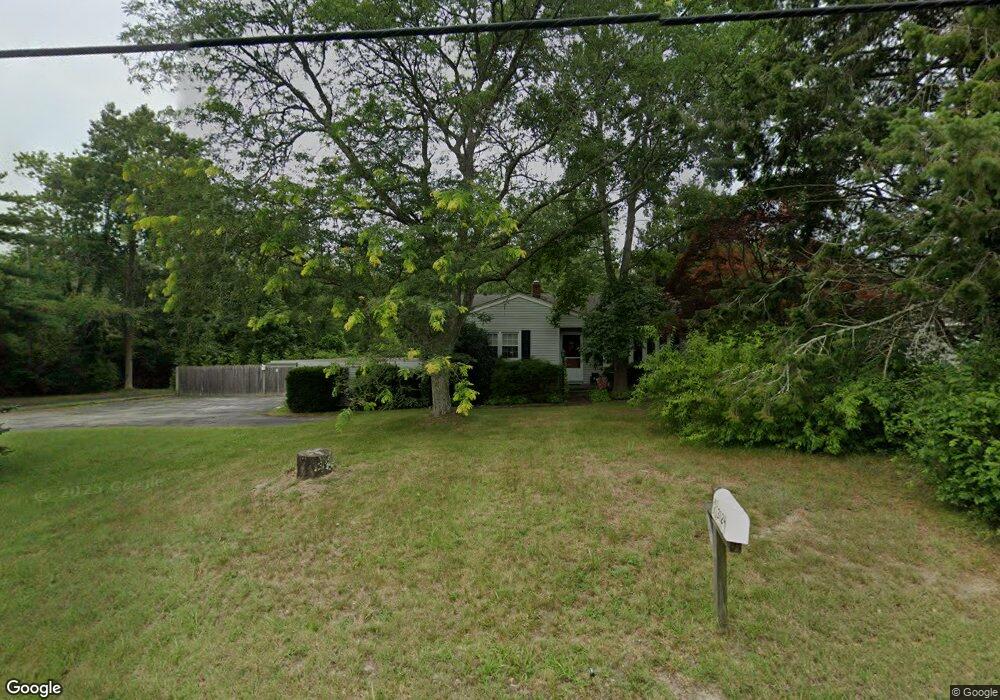
3124 N Route 9 Ocean View, NJ 08230
Estimated Value: $257,883 - $392,000
--
Bed
--
Bath
928
Sq Ft
$364/Sq Ft
Est. Value
About This Home
This home is located at 3124 N Route 9, Ocean View, NJ 08230 and is currently estimated at $337,721, approximately $363 per square foot. 3124 N Route 9 is a home located in Cape May County with nearby schools including Upper Township Primary School, Upper Township Elementary School, and Upper Township Middle School.
Ownership History
Date
Name
Owned For
Owner Type
Purchase Details
Closed on
Jan 30, 2016
Sold by
Smith Pauline S and Roberts Karen S B
Bought by
Roberts Karen S B and Bernard Michael
Current Estimated Value
Purchase Details
Closed on
Dec 7, 2007
Sold by
Smith Martin J and Smith Pauline S
Bought by
Smith Pauline S
Purchase Details
Closed on
Jan 29, 1993
Sold by
Martin Stephen R and Martin Deluca,Sharon
Bought by
Smith Martin J and Smith Pauline S
Purchase Details
Closed on
Oct 19, 1989
Sold by
Reed William and Reed Gretchen
Bought by
Martin Stephen and Martin Deluca,Sharon
Create a Home Valuation Report for This Property
The Home Valuation Report is an in-depth analysis detailing your home's value as well as a comparison with similar homes in the area
Home Values in the Area
Average Home Value in this Area
Purchase History
| Date | Buyer | Sale Price | Title Company |
|---|---|---|---|
| Roberts Karen S B | -- | None Available | |
| Smith Pauline S | -- | None Available | |
| Smith Martin J | $92,000 | -- | |
| Martin Stephen | $86,000 | -- |
Source: Public Records
Tax History Compared to Growth
Tax History
| Year | Tax Paid | Tax Assessment Tax Assessment Total Assessment is a certain percentage of the fair market value that is determined by local assessors to be the total taxable value of land and additions on the property. | Land | Improvement |
|---|---|---|---|---|
| 2025 | $4,142 | $180,500 | $95,500 | $85,000 |
| 2024 | $4,142 | $180,500 | $95,500 | $85,000 |
| 2023 | $3,939 | $180,500 | $95,500 | $85,000 |
| 2022 | $3,807 | $180,500 | $95,500 | $85,000 |
| 2021 | $3,449 | $180,500 | $95,500 | $85,000 |
| 2020 | $3,534 | $180,500 | $95,500 | $85,000 |
| 2019 | $3,449 | $180,500 | $95,500 | $85,000 |
| 2018 | $3,361 | $180,500 | $95,500 | $85,000 |
| 2017 | $3,323 | $180,500 | $95,500 | $85,000 |
| 2016 | $2,936 | $157,000 | $95,500 | $61,500 |
| 2015 | $2,609 | $157,000 | $95,500 | $61,500 |
| 2014 | $3,259 | $236,000 | $146,400 | $89,600 |
Source: Public Records
Map
Nearby Homes
- 8 Huntington Ln
- 3066 N Route 9
- 3066 U S 9
- 3066 U S 9 Unit 196
- 3066 U S 9 Unit 246
- 3065 U S 9
- 80 W Rising Sun Dr
- 15 Clayton Dr
- 70 W Rising Sun Dr
- 18 Corson Ln
- 7 Corson Ln
- 60 Corsons Tavern Rd Unit 148
- 28 Luke Ct
- 2058 S Shore Rd
- 12 Ashcroft Ave
- 515 Corsons Tavern Rd Unit J-3
- 515 Corsons Tavern Rd Unit F-49
- 515 Corsons Tavern Rd Unit H-61
- 515 Corsons Tavern Rd Unit F-32
- 515 Corsons Tavern Rd Unit D-49