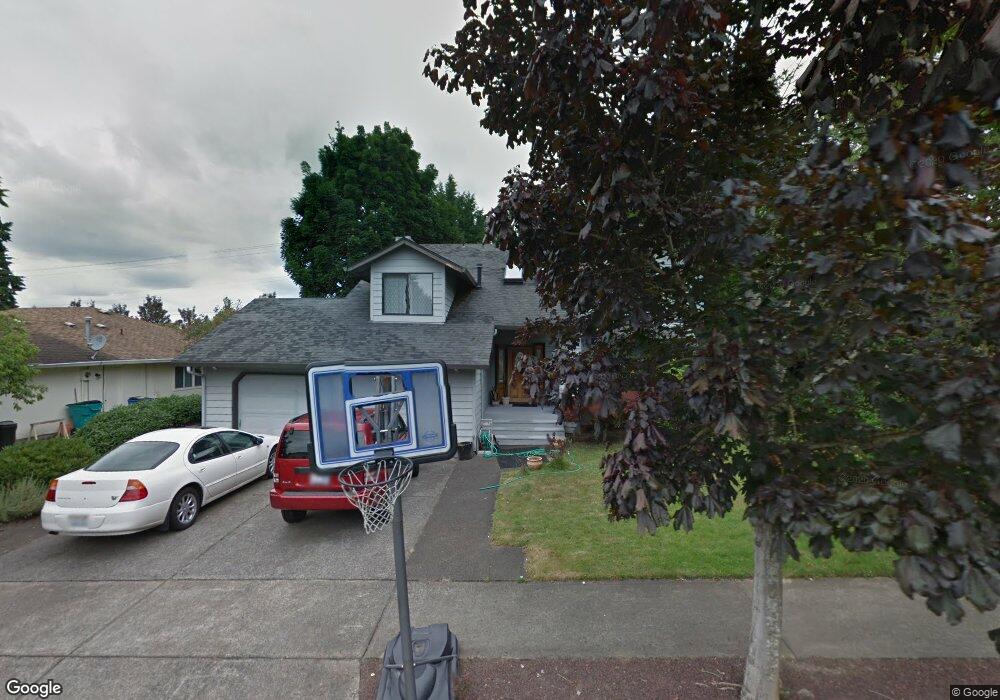
3124 NE 98th Cir Vancouver, WA 98665
Northeast Hazel Dell NeighborhoodEstimated Value: $542,000 - $565,000
3
Beds
3
Baths
1,916
Sq Ft
$288/Sq Ft
Est. Value
About This Home
This home is located at 3124 NE 98th Cir, Vancouver, WA 98665 and is currently estimated at $552,273, approximately $288 per square foot. 3124 NE 98th Cir is a home located in Clark County with nearby schools including Sarah J. Anderson Elementary School, Gaiser Middle School, and Skyview High School.
Ownership History
Date
Name
Owned For
Owner Type
Purchase Details
Closed on
Sep 13, 2023
Sold by
Heights Villa Apartment Corpor
Bought by
Pinewood Apartment Association Inc
Current Estimated Value
Purchase Details
Closed on
Mar 1, 1998
Sold by
Goerlich Richard F
Bought by
Heights Villa Apartment Corp
Home Financials for this Owner
Home Financials are based on the most recent Mortgage that was taken out on this home.
Original Mortgage
$112,000
Interest Rate
7.06%
Mortgage Type
Construction
Purchase Details
Closed on
Aug 15, 1996
Sold by
Goerlich Richard F
Bought by
Heights Villa Apartment Corp
Home Financials for this Owner
Home Financials are based on the most recent Mortgage that was taken out on this home.
Original Mortgage
$112,000
Interest Rate
8.42%
Create a Home Valuation Report for This Property
The Home Valuation Report is an in-depth analysis detailing your home's value as well as a comparison with similar homes in the area
Home Values in the Area
Average Home Value in this Area
Purchase History
| Date | Buyer | Sale Price | Title Company |
|---|---|---|---|
| Pinewood Apartment Association Inc | $313 | None Listed On Document | |
| Heights Villa Apartment Corp | -- | Chicago Title Insurance | |
| Heights Villa Apartment Corp | $112,000 | -- |
Source: Public Records
Mortgage History
| Date | Status | Borrower | Loan Amount |
|---|---|---|---|
| Previous Owner | Heights Villa Apartment Corp | $112,000 | |
| Previous Owner | Heights Villa Apartment Corp | $112,000 |
Source: Public Records
Tax History Compared to Growth
Tax History
| Year | Tax Paid | Tax Assessment Tax Assessment Total Assessment is a certain percentage of the fair market value that is determined by local assessors to be the total taxable value of land and additions on the property. | Land | Improvement |
|---|---|---|---|---|
| 2025 | $4,772 | $496,296 | $186,600 | $309,696 |
| 2024 | $4,560 | $450,638 | $186,600 | $264,038 |
| 2023 | $4,329 | $481,533 | $184,500 | $297,033 |
| 2022 | $4,226 | $438,698 | $184,500 | $254,198 |
| 2021 | $3,898 | $381,540 | $138,950 | $242,590 |
| 2020 | $3,538 | $330,015 | $111,750 | $218,265 |
| 2019 | $3,188 | $318,042 | $117,700 | $200,342 |
| 2018 | $3,466 | $296,900 | $0 | $0 |
| 2017 | $3,043 | $269,478 | $0 | $0 |
| 2016 | $2,943 | $245,804 | $0 | $0 |
| 2015 | $2,898 | $222,216 | $0 | $0 |
| 2014 | -- | $211,252 | $0 | $0 |
| 2013 | -- | $185,953 | $0 | $0 |
Source: Public Records
Map
Nearby Homes
- 2812 NE 99th St
- 6712 NW 26th Ct
- 3615 NE 102nd St
- 6717 NE 27th Place
- 3117 NE 106th St
- 10216 NE 27th Ave
- 2506 NE 100th St
- 9408 NE 39th Ave
- 3217 NE 91st St
- 2806 NE 105th Cir
- 3801 NE 93rd St
- 2402 NE 96th St
- 10619 NE 30th Ave
- 8915 NE 28th Place
- 2313 NE 102nd St
- 3300 NE 90th Cir
- 10702 NE 37th Ct
- 9507 NE 41st Ave
- 8914 NE 28th Place
- 2319 NE 104th St
- 3120 NE 98th Cir
- 3204 NE 98th Cir
- 3114 NE 98th Cir
- 3123 NE 98th Cir
- 3119 NE 98th Cir
- 3208 NE 98th Cir
- 3108 NE 98th Cir
- 3113 NE 98th Cir
- 3203 NE 98th Cir
- 3118 NE 97th Cir
- 3109 NE 98th Cir
- 9704 NE 32nd Ave
- 9906 NE 33rd Ct
- 3102 NE 98th Cir
- 3306 NE 98th Cir
- 3207 NE 98th Cir
- 3114 NE 97th Cir
- 9902 NE 33rd Ct
- 3105 NE 98th Cir
- 3108 NE 97th Cir