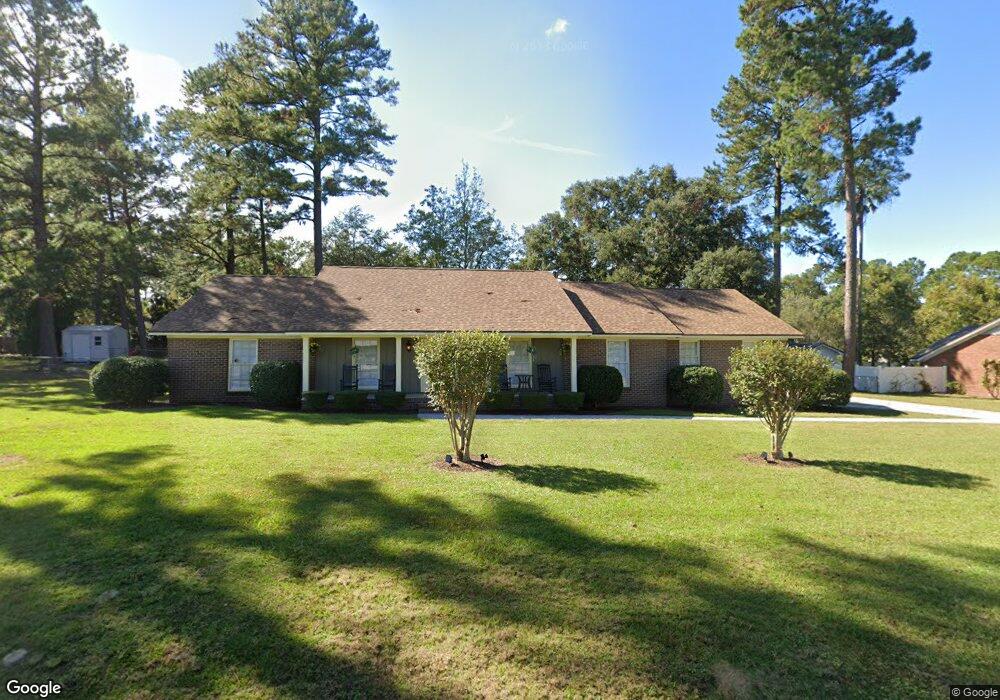
3125 Ash Dr Waycross, GA 31501
Estimated Value: $199,000 - $274,000
3
Beds
2
Baths
1,952
Sq Ft
$117/Sq Ft
Est. Value
About This Home
This home is located at 3125 Ash Dr, Waycross, GA 31501 and is currently estimated at $229,245, approximately $117 per square foot. 3125 Ash Dr is a home located in Ware County with nearby schools including Wacona Elementary School, Ware County Middle School, and Ware County High School.
Ownership History
Date
Name
Owned For
Owner Type
Purchase Details
Closed on
Aug 19, 2022
Sold by
Jolley Shahidah
Bought by
Wilson Anthony T and Wilson Angela L
Current Estimated Value
Home Financials for this Owner
Home Financials are based on the most recent Mortgage that was taken out on this home.
Original Mortgage
$159,200
Outstanding Balance
$151,846
Interest Rate
5.22%
Mortgage Type
New Conventional
Estimated Equity
$77,399
Purchase Details
Closed on
Sep 13, 2000
Sold by
Murray Terrell and Murray Bunda
Bought by
Jolley James A
Purchase Details
Closed on
Sep 6, 2000
Sold by
Jolley James A
Bought by
Jolley James A and Jolley Shahidah H
Purchase Details
Closed on
Dec 4, 1992
Bought by
Jolly James A
Purchase Details
Closed on
Aug 31, 1990
Bought by
Terrell Terrell S and Terrell Brenda J
Purchase Details
Closed on
Apr 14, 1988
Create a Home Valuation Report for This Property
The Home Valuation Report is an in-depth analysis detailing your home's value as well as a comparison with similar homes in the area
Home Values in the Area
Average Home Value in this Area
Purchase History
| Date | Buyer | Sale Price | Title Company |
|---|---|---|---|
| Wilson Anthony T | $199,000 | -- | |
| Jolley James A | -- | -- | |
| Jolley James A | -- | -- | |
| Jolly James A | $76,000 | -- | |
| Terrell Terrell S | $74,500 | -- | |
| -- | $71,000 | -- |
Source: Public Records
Mortgage History
| Date | Status | Borrower | Loan Amount |
|---|---|---|---|
| Open | Wilson Anthony T | $159,200 |
Source: Public Records
Tax History Compared to Growth
Tax History
| Year | Tax Paid | Tax Assessment Tax Assessment Total Assessment is a certain percentage of the fair market value that is determined by local assessors to be the total taxable value of land and additions on the property. | Land | Improvement |
|---|---|---|---|---|
| 2024 | $2,087 | $79,876 | $7,280 | $72,596 |
| 2023 | $2,056 | $68,389 | $8,154 | $60,235 |
| 2022 | $1,442 | $68,389 | $8,154 | $60,235 |
| 2021 | $1,309 | $54,112 | $8,154 | $45,958 |
| 2020 | $1,297 | $52,527 | $8,154 | $44,373 |
| 2019 | $1,173 | $43,610 | $8,154 | $35,456 |
| 2018 | $1,158 | $42,095 | $8,154 | $33,941 |
| 2017 | $1,148 | $41,576 | $8,154 | $33,422 |
| 2016 | $1,148 | $41,576 | $8,154 | $33,422 |
| 2015 | $1,159 | $41,576 | $8,154 | $33,422 |
| 2014 | $1,158 | $41,576 | $8,154 | $33,422 |
| 2013 | -- | $41,576 | $8,154 | $33,422 |
Source: Public Records
Map
Nearby Homes