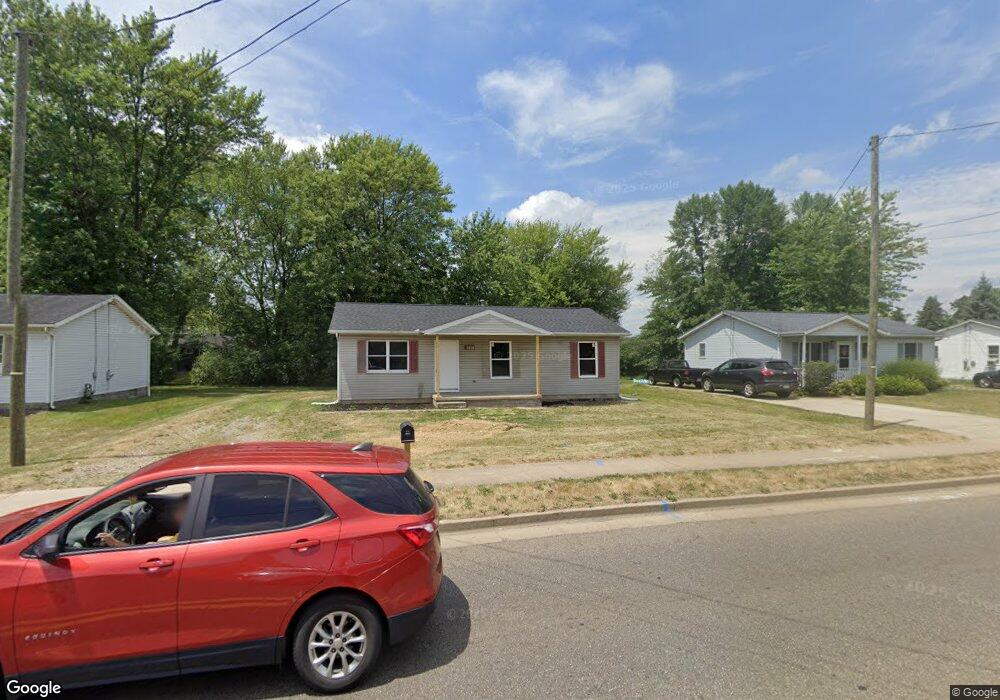
3125 Harmont Ave NE Canton, OH 44705
Fairmount NeighborhoodEstimated Value: $90,000 - $150,344
3
Beds
1
Bath
1,040
Sq Ft
$121/Sq Ft
Est. Value
About This Home
This home is located at 3125 Harmont Ave NE, Canton, OH 44705 and is currently estimated at $125,586, approximately $120 per square foot. 3125 Harmont Ave NE is a home located in Stark County with nearby schools including Belle Stone Elementary School, Early Learning Center @ Schreiber, and Youtz Intermediate School.
Ownership History
Date
Name
Owned For
Owner Type
Purchase Details
Closed on
Jul 29, 2024
Sold by
Ks Yoak Enterprises Llc
Bought by
Rahill Alexander William
Current Estimated Value
Home Financials for this Owner
Home Financials are based on the most recent Mortgage that was taken out on this home.
Original Mortgage
$112,000
Outstanding Balance
$110,733
Interest Rate
6.87%
Mortgage Type
New Conventional
Estimated Equity
$14,853
Purchase Details
Closed on
May 3, 2024
Sold by
Penn Frank E
Bought by
Ks Yoak Enterprises Llc
Home Financials for this Owner
Home Financials are based on the most recent Mortgage that was taken out on this home.
Original Mortgage
$78,000
Interest Rate
6.82%
Mortgage Type
Balloon
Purchase Details
Closed on
Jul 29, 1994
Sold by
Habitat For Humanity
Bought by
Penn Frank E and Penn Patricia
Home Financials for this Owner
Home Financials are based on the most recent Mortgage that was taken out on this home.
Original Mortgage
$32,670
Interest Rate
8.41%
Mortgage Type
New Conventional
Purchase Details
Closed on
Jul 13, 1993
Create a Home Valuation Report for This Property
The Home Valuation Report is an in-depth analysis detailing your home's value as well as a comparison with similar homes in the area
Home Values in the Area
Average Home Value in this Area
Purchase History
| Date | Buyer | Sale Price | Title Company |
|---|---|---|---|
| Rahill Alexander William | -- | None Listed On Document | |
| Ks Yoak Enterprises Llc | $45,000 | None Listed On Document | |
| Penn Frank E | $33,000 | -- | |
| -- | -- | -- |
Source: Public Records
Mortgage History
| Date | Status | Borrower | Loan Amount |
|---|---|---|---|
| Open | Rahill Alexander William | $112,000 | |
| Previous Owner | Ks Yoak Enterprises Llc | $78,000 | |
| Previous Owner | Penn Frank E | $32,670 |
Source: Public Records
Tax History Compared to Growth
Tax History
| Year | Tax Paid | Tax Assessment Tax Assessment Total Assessment is a certain percentage of the fair market value that is determined by local assessors to be the total taxable value of land and additions on the property. | Land | Improvement |
|---|---|---|---|---|
| 2025 | -- | $33,780 | $6,300 | $27,480 |
| 2024 | -- | $33,780 | $6,300 | $27,480 |
| 2023 | $4,963 | $26,080 | $4,340 | $21,740 |
| 2022 | $1,009 | $26,080 | $4,340 | $21,740 |
| 2021 | $1,019 | $26,080 | $4,340 | $21,740 |
| 2020 | $690 | $19,220 | $3,220 | $16,000 |
| 2019 | $602 | $19,220 | $3,220 | $16,000 |
| 2018 | $606 | $19,220 | $3,220 | $16,000 |
| 2017 | $3,737 | $19,220 | $3,190 | $16,030 |
| 2016 | $3,759 | $19,220 | $3,190 | $16,030 |
| 2015 | $705 | $19,220 | $3,190 | $16,030 |
| 2014 | $624 | $17,890 | $2,980 | $14,910 |
| 2013 | $585 | $17,890 | $2,980 | $14,910 |
Source: Public Records
Map
Nearby Homes
- 3023 Bollinger Ave NE
- 3015 Bollinger Ave NE
- 2941 Fletcher Ave NE
- 2827 Daleford Ave NE
- 3504 Fairmount Blvd NE
- 2940 Ellis Ave NE
- 2602 Baldwin Ave NE
- 3305 Regent Ave NE
- 2310 Willowrow Ave NE
- 2409 Gilbert Ave NE
- 3730 Kirby Ave NE
- 2319 Daleford Ave NE
- 3421 Mahoning Rd NE
- 3022 Taft Ave NE
- 4123 Regentview St NE
- 2715 19th St NE
- 1821 Wallace Ave NE
- 1909 Gridley Ave NE
- 2314 24th St NE
- 1710 Harmont Ave NE
- 3119 Harmont Ave NE
- 3303 31st St NE
- 3111 Harmont Ave NE
- 3205 Harmont Ave NE
- 3110 Bollinger Ave NE
- 3309 31st St NE
- 3211 Harmont Ave NE
- 3105 Harmont Ave NE
- 3104 Bollinger Ave NE
- 3116 Bollinger Ave NE
- 3034 Bollinger Ave NE
- 3302 31st St NE
- 3214 33rd St NE
- 3315 31st St NE
- 3210 Harmont Ave NE
- 3025 Harmont Ave NE
- 3217 Harmont Ave NE
- 3308 31st St NE
- 3028 Bollinger Ave NE
- 3202 Bollinger Ave NE