3125 NE 48th Ct Unit 221 Lighthouse Point, FL 33064
Estimated Value: $341,860 - $461,000
3
Beds
2
Baths
1,056
Sq Ft
$373/Sq Ft
Est. Value
About This Home
This home is located at 3125 NE 48th Ct Unit 221, Lighthouse Point, FL 33064 and is currently estimated at $393,715, approximately $372 per square foot. 3125 NE 48th Ct Unit 221 is a home located in Broward County with nearby schools including Norcrest Elementary School, Deerfield Beach Middle School, and Deerfield Beach High School.
Ownership History
Date
Name
Owned For
Owner Type
Purchase Details
Closed on
Mar 10, 2009
Sold by
Carlson Jameson Betty Louise and Estate Of Isabelle I Carlson
Bought by
Movsesian Ani N
Current Estimated Value
Home Financials for this Owner
Home Financials are based on the most recent Mortgage that was taken out on this home.
Original Mortgage
$140,000
Outstanding Balance
$89,021
Interest Rate
5.13%
Mortgage Type
Purchase Money Mortgage
Estimated Equity
$304,694
Purchase Details
Closed on
Jun 30, 2005
Sold by
Carlson Isabelle
Bought by
Carlson Carlson Isabelle Isabelle and Carlson Jameson Betty Louise
Purchase Details
Closed on
Apr 1, 1990
Sold by
Available Not
Bought by
Available Not
Create a Home Valuation Report for This Property
The Home Valuation Report is an in-depth analysis detailing your home's value as well as a comparison with similar homes in the area
Home Values in the Area
Average Home Value in this Area
Purchase History
| Date | Buyer | Sale Price | Title Company |
|---|---|---|---|
| Movsesian Ani N | $175,000 | Consumer Title Services | |
| Carlson Carlson Isabelle Isabelle | $17,500 | Attorney | |
| Available Not | $78,571 | -- |
Source: Public Records
Mortgage History
| Date | Status | Borrower | Loan Amount |
|---|---|---|---|
| Open | Movsesian Ani N | $140,000 |
Source: Public Records
Tax History Compared to Growth
Tax History
| Year | Tax Paid | Tax Assessment Tax Assessment Total Assessment is a certain percentage of the fair market value that is determined by local assessors to be the total taxable value of land and additions on the property. | Land | Improvement |
|---|---|---|---|---|
| 2025 | $2,741 | $173,080 | -- | -- |
| 2024 | $2,578 | $168,210 | -- | -- |
| 2023 | $2,578 | $163,320 | $0 | $0 |
| 2022 | $2,293 | $158,570 | $0 | $0 |
| 2021 | $2,225 | $153,960 | $0 | $0 |
| 2020 | $2,184 | $151,840 | $0 | $0 |
| 2019 | $2,139 | $148,430 | $0 | $0 |
| 2018 | $2,014 | $145,670 | $0 | $0 |
| 2017 | $1,981 | $142,680 | $0 | $0 |
| 2016 | $1,951 | $139,750 | $0 | $0 |
| 2015 | $1,991 | $138,780 | $0 | $0 |
| 2014 | $2,006 | $137,680 | $0 | $0 |
| 2013 | -- | $151,320 | $15,130 | $136,190 |
Source: Public Records
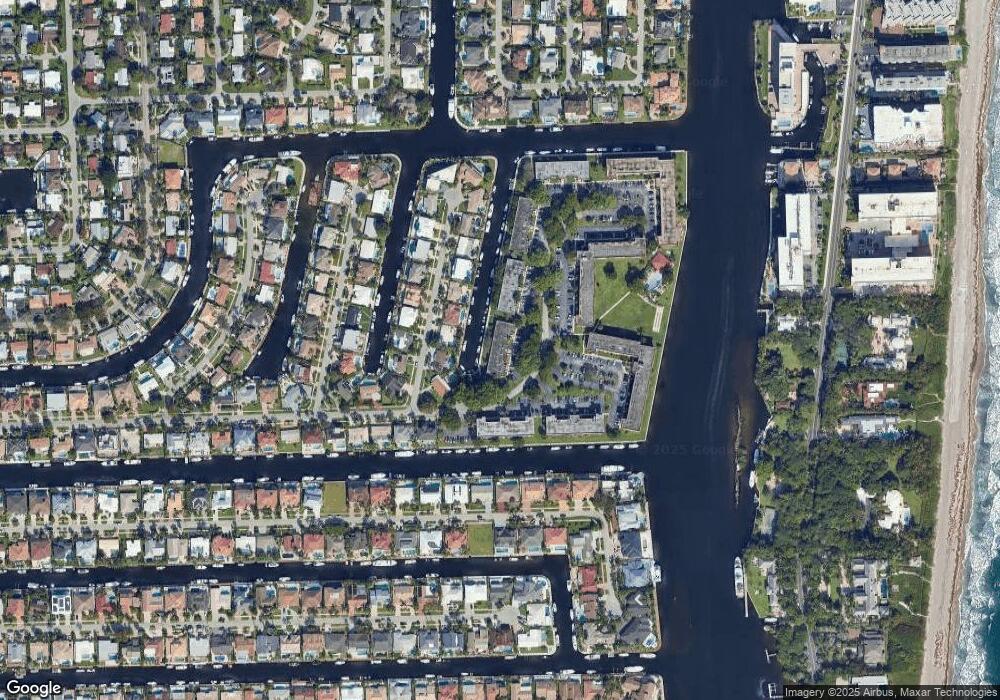
Map
Nearby Homes
- 3050 NE 48th Ct Unit 401
- 3050 NE 48th Ct Unit 402
- 3050 NE 48th Ct Unit 303
- 2901 NE 47th St
- 3150 NE 48th Ct Unit 107
- 3000 NE 48th Ct Unit 302
- 3020 NE 47th St
- 2810 NE 48th Ct
- 2800 NE 48th St
- 2901 NE 46th St
- 3100 NE 48th Ct Unit 415
- 4850 NE 29th Ave
- 4821 NE 28th Ave
- 3100 NE 46th St
- 2751 NE 46th St
- 4460 NE 31st Ave
- 4930 NE 28th Ave
- 2680 NE 47th St
- 2750 NE 45th St
- 4930 NE 27th Terrace
- 3125 NE 48th Ct Unit 120
- 3125 NE 48th Ct Unit 124
- 3125 NE 48th Ct Unit 119
- 3125 NE 48th Ct Unit 224
- 3125 NE 48th Ct Unit 121
- 3125 NE 48th Ct Unit 219
- 3125 NE 48th Ct Unit 220
- 3125 NE 48th Ct Unit 123
- 3125 NE 48th Ct Unit 122
- 3145 NE 48th Ct Unit 114
- 3145 NE 48th Ct Unit 215
- 3145 NE 48th Ct Unit 218
- 3145 NE 48th Ct Unit 116
- 3145 NE 48th Ct Unit 216
- 3145 NE 48th Ct Unit 213
- 3145 NE 48th Ct Unit 217
- 3145 NE 48th Ct Unit 113
- 3145 NE 48th Ct Unit 214
- 3145 NE 48th Ct Unit 118
- 3145 NE 48th Ct Unit 115