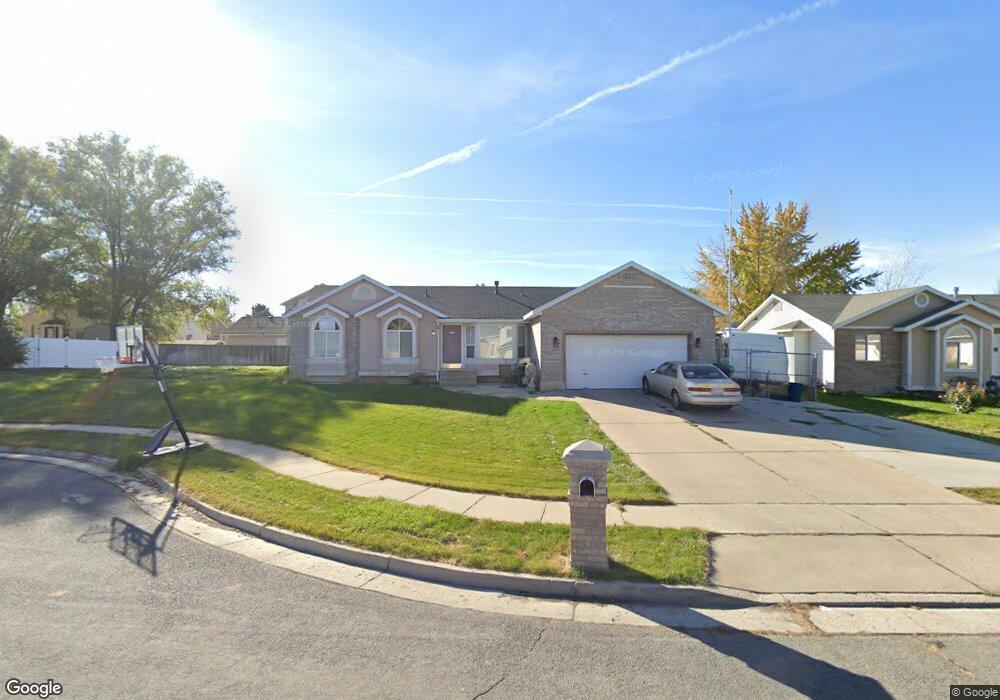
3125 W 1150 N Clearfield, UT 84015
Estimated Value: $519,000 - $536,000
4
Beds
2
Baths
2,832
Sq Ft
$186/Sq Ft
Est. Value
About This Home
This home is located at 3125 W 1150 N, Clearfield, UT 84015 and is currently estimated at $527,353, approximately $186 per square foot. 3125 W 1150 N is a home located in Davis County with nearby schools including Lakeside School, West Point Junior High School, and Syracuse High School.
Ownership History
Date
Name
Owned For
Owner Type
Purchase Details
Closed on
Jan 29, 2016
Sold by
Haddock Gary L
Bought by
Haddock Mindi J
Current Estimated Value
Purchase Details
Closed on
Jan 29, 2003
Sold by
Rhees Reuben Thomas and Rhees Jenny Sue
Bought by
Haddock Gary L and Haddock Mindi J
Purchase Details
Closed on
Feb 27, 2001
Sold by
Rhees Reuben T
Bought by
Rhees Reuben Thomas and Rhees Jenny Sue
Purchase Details
Closed on
Oct 14, 2000
Sold by
Esplin Steven L and Esplin Nalyn R
Bought by
Rhees Ruben T
Home Financials for this Owner
Home Financials are based on the most recent Mortgage that was taken out on this home.
Original Mortgage
$146,727
Interest Rate
6.98%
Mortgage Type
FHA
Create a Home Valuation Report for This Property
The Home Valuation Report is an in-depth analysis detailing your home's value as well as a comparison with similar homes in the area
Home Values in the Area
Average Home Value in this Area
Purchase History
| Date | Buyer | Sale Price | Title Company |
|---|---|---|---|
| Haddock Mindi J | -- | Founders Title | |
| Haddock Gary L | -- | Bonneville Title Company Inc | |
| Haddock Gary L | -- | Bonneville Title Company Inc | |
| Rhees Reuben Thomas | -- | Bonneville Title Company Inc | |
| Rhees Reuben Thomas | -- | Bonneville Title Company Inc | |
| Rhees Ruben T | -- | Bonneville Title Company Inc |
Source: Public Records
Mortgage History
| Date | Status | Borrower | Loan Amount |
|---|---|---|---|
| Previous Owner | Rhees Ruben T | $146,727 |
Source: Public Records
Tax History Compared to Growth
Tax History
| Year | Tax Paid | Tax Assessment Tax Assessment Total Assessment is a certain percentage of the fair market value that is determined by local assessors to be the total taxable value of land and additions on the property. | Land | Improvement |
|---|---|---|---|---|
| 2025 | $2,935 | $275,000 | $108,584 | $166,416 |
| 2024 | $2,781 | $261,800 | $97,779 | $164,021 |
| 2023 | $2,576 | $446,000 | $120,566 | $325,434 |
| 2022 | $2,780 | $263,450 | $62,351 | $201,099 |
| 2021 | $2,518 | $357,000 | $98,836 | $258,164 |
| 2020 | $2,209 | $309,000 | $82,771 | $226,229 |
| 2019 | $2,124 | $293,000 | $84,400 | $208,600 |
| 2018 | $1,934 | $263,000 | $85,003 | $177,997 |
| 2016 | $1,693 | $121,165 | $32,863 | $88,302 |
| 2015 | $1,617 | $109,615 | $32,863 | $76,752 |
| 2014 | $1,277 | $112,652 | $32,863 | $79,789 |
| 2013 | -- | $89,820 | $28,435 | $61,385 |
Source: Public Records
Map
Nearby Homes