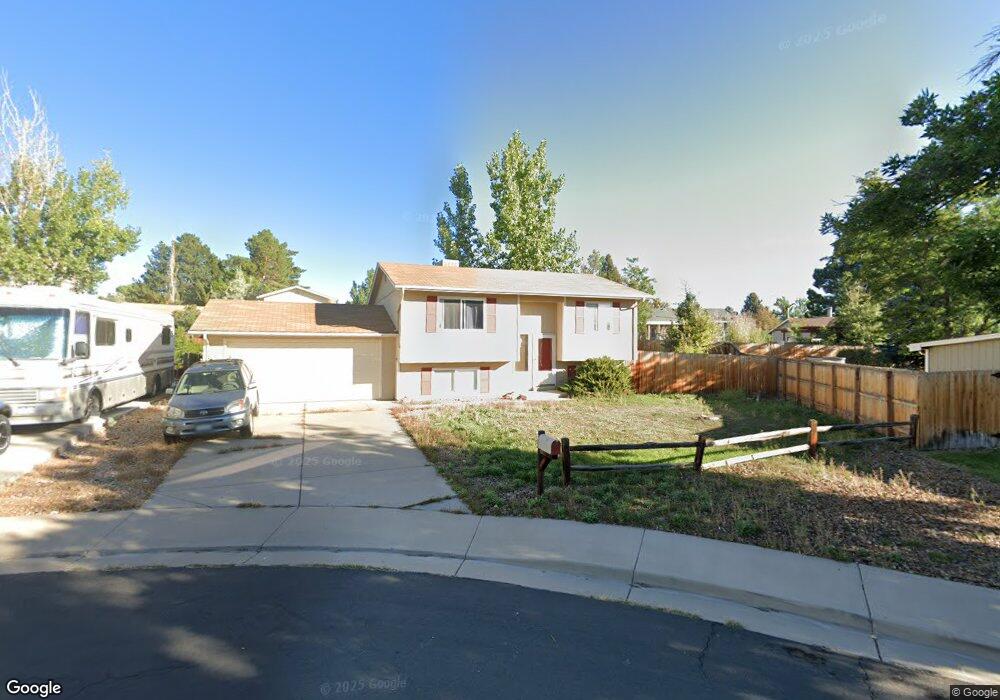
3125 W 134th Ct Broomfield, CO 80020
Westlake Village NeighborhoodEstimated Value: $473,309 - $510,000
4
Beds
2
Baths
1,538
Sq Ft
$320/Sq Ft
Est. Value
About This Home
This home is located at 3125 W 134th Ct, Broomfield, CO 80020 and is currently estimated at $492,577, approximately $320 per square foot. 3125 W 134th Ct is a home located in Broomfield County with nearby schools including Centennial Elementary School, Westlake Middle School, and Legacy High School.
Ownership History
Date
Name
Owned For
Owner Type
Purchase Details
Closed on
Apr 13, 2012
Sold by
Sinn Fred
Bought by
Le Joe Cao
Current Estimated Value
Home Financials for this Owner
Home Financials are based on the most recent Mortgage that was taken out on this home.
Original Mortgage
$184,013
Outstanding Balance
$130,580
Interest Rate
4.5%
Mortgage Type
FHA
Estimated Equity
$361,997
Purchase Details
Closed on
Jun 15, 2011
Sold by
Fannie Mae
Bought by
Sinn Fred
Purchase Details
Closed on
Apr 14, 2011
Sold by
Fuentes Job and Fuentes Myrna Veronica
Bought by
Federal National Mortgage Association
Purchase Details
Closed on
Nov 23, 2001
Sold by
Manion Daniel J and Manion Regina A
Bought by
Fuentes Job and Fuentes Myrna Veronica
Home Financials for this Owner
Home Financials are based on the most recent Mortgage that was taken out on this home.
Original Mortgage
$172,463
Interest Rate
6.57%
Mortgage Type
FHA
Create a Home Valuation Report for This Property
The Home Valuation Report is an in-depth analysis detailing your home's value as well as a comparison with similar homes in the area
Home Values in the Area
Average Home Value in this Area
Purchase History
| Date | Buyer | Sale Price | Title Company |
|---|---|---|---|
| Le Joe Cao | $188,800 | None Available | |
| Sinn Fred | $126,000 | None Available | |
| Federal National Mortgage Association | -- | None Available | |
| Fuentes Job | $174,900 | Land Title Guarantee Company |
Source: Public Records
Mortgage History
| Date | Status | Borrower | Loan Amount |
|---|---|---|---|
| Open | Le Joe Cao | $184,013 | |
| Previous Owner | Fuentes Job | $172,463 |
Source: Public Records
Tax History Compared to Growth
Tax History
| Year | Tax Paid | Tax Assessment Tax Assessment Total Assessment is a certain percentage of the fair market value that is determined by local assessors to be the total taxable value of land and additions on the property. | Land | Improvement |
|---|---|---|---|---|
| 2025 | $3,034 | $30,530 | $8,040 | $22,490 |
| 2024 | $3,034 | $28,290 | $7,110 | $21,180 |
| 2023 | $3,006 | $33,180 | $8,340 | $24,840 |
| 2022 | $2,498 | $22,110 | $5,770 | $16,340 |
| 2021 | $2,575 | $22,740 | $5,930 | $16,810 |
| 2020 | $2,527 | $22,080 | $5,510 | $16,570 |
| 2019 | $2,529 | $22,230 | $5,540 | $16,690 |
| 2018 | $2,236 | $18,960 | $4,210 | $14,750 |
| 2017 | $2,037 | $20,970 | $4,660 | $16,310 |
| 2016 | $1,839 | $16,680 | $4,660 | $12,020 |
| 2015 | $1,839 | $13,180 | $4,660 | $8,520 |
| 2014 | $1,493 | $13,180 | $4,660 | $8,520 |
Source: Public Records
Map
Nearby Homes
- 3213 W 133rd Ave
- 3223 W 133rd Ave
- 13180 Grove Way
- 3083 W 134th Cir
- 2595 W 133rd Cir
- 2537 W 132nd Way
- 13050 Hazel Ct
- 3574 Buffalo Ave
- 13648 Plaster Point Unit 102
- 3220 Boulder Cir Unit 103
- 13380 Red Deer Trail
- 3420 Boulder Cir Unit 201
- 3686 Glacier Rim Trail Unit E
- 2885 E Midway Blvd Unit 188
- 2885 E Midway Blvd Unit 1309
- 2885 E Midway Blvd Unit 1256
- 2885 E Midway Blvd Unit 448
- 2885 E Midway Blvd Unit 1417
- 13676 Rock Point Unit 101
- 3311 Queen Ct
- 3115 W 134th Ct
- 3135 W 134th Ct
- 13400 Grove Way
- 13390 Grove Way
- 13380 Grove Way
- 13410 Grove Way
- 3105 W 134th Ct
- 3136 W 134th Ct
- 3126 W 134th Ct
- 13370 Grove Way
- 3116 W 134th Ct
- 13395 Grove Way
- 13405 Grove Way
- 3269 W 134th Place
- 3279 W 134th Place
- 13415 Grove Way
- 13385 Grove Way
- 3106 W 134th Ct
- 3159 W 134th Place
- 3289 W 134th Place