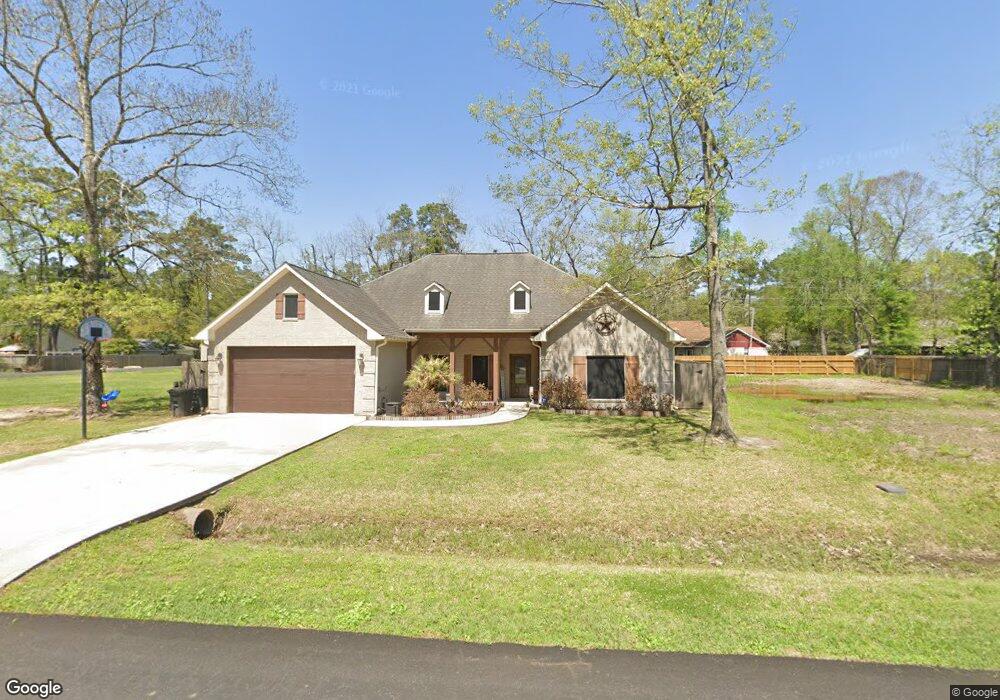
3126 Deep Anchor Way Crosby, TX 77532
Estimated Value: $282,000 - $324,000
4
Beds
2
Baths
2,023
Sq Ft
$149/Sq Ft
Est. Value
About This Home
This home is located at 3126 Deep Anchor Way, Crosby, TX 77532 and is currently estimated at $302,179, approximately $149 per square foot. 3126 Deep Anchor Way is a home located in Harris County with nearby schools including Newport Elementary School, Crosby Middle School, and Crosby High School.
Ownership History
Date
Name
Owned For
Owner Type
Purchase Details
Closed on
Dec 21, 2017
Sold by
Vanderford Paul
Bought by
Taylor Bobby and Phillips Krissi M
Current Estimated Value
Home Financials for this Owner
Home Financials are based on the most recent Mortgage that was taken out on this home.
Original Mortgage
$267,900
Outstanding Balance
$225,607
Interest Rate
3.95%
Mortgage Type
New Conventional
Estimated Equity
$76,572
Purchase Details
Closed on
Mar 7, 2011
Sold by
Mcmorries Kymberly P
Bought by
Vanderford Paul
Purchase Details
Closed on
Jul 21, 2008
Sold by
Rodgers Richie W
Bought by
Rodgers Cheryl L
Home Financials for this Owner
Home Financials are based on the most recent Mortgage that was taken out on this home.
Original Mortgage
$103,500
Interest Rate
6.4%
Mortgage Type
New Conventional
Purchase Details
Closed on
Jan 4, 2006
Sold by
Brown Gwen
Bought by
Brown Gwen and Kayda David M
Purchase Details
Closed on
Dec 27, 2002
Sold by
Segura Joe
Bought by
Brown Gwen
Purchase Details
Closed on
Mar 10, 2001
Sold by
Meca Investments
Bought by
Rodgers Richie W and Rodgers Cheryl L
Purchase Details
Closed on
Jul 16, 1998
Sold by
Radford Dixie W and Radford Thomas O
Bought by
Meca Investments
Create a Home Valuation Report for This Property
The Home Valuation Report is an in-depth analysis detailing your home's value as well as a comparison with similar homes in the area
Home Values in the Area
Average Home Value in this Area
Purchase History
| Date | Buyer | Sale Price | Title Company |
|---|---|---|---|
| Taylor Bobby | -- | First American Title | |
| Vanderford Paul | -- | Fidelity National Title | |
| Rodgers Cheryl L | -- | None Available | |
| Brown Gwen | -- | None Available | |
| Brown Gwen | -- | American Title Co | |
| Rodgers Richie W | -- | -- | |
| Meca Investments | $1,560 | -- |
Source: Public Records
Mortgage History
| Date | Status | Borrower | Loan Amount |
|---|---|---|---|
| Open | Taylor Bobby | $267,900 | |
| Previous Owner | Rodgers Cheryl L | $103,500 |
Source: Public Records
Tax History Compared to Growth
Tax History
| Year | Tax Paid | Tax Assessment Tax Assessment Total Assessment is a certain percentage of the fair market value that is determined by local assessors to be the total taxable value of land and additions on the property. | Land | Improvement |
|---|---|---|---|---|
| 2025 | $5,887 | $273,647 | $61,857 | $211,790 |
| 2024 | $5,887 | $273,647 | $53,325 | $220,322 |
| 2023 | $5,887 | $288,005 | $49,059 | $238,946 |
| 2022 | $6,219 | $288,080 | $36,261 | $251,819 |
| 2021 | $5,829 | $217,139 | $25,596 | $191,543 |
| 2020 | $6,787 | $239,051 | $25,596 | $213,455 |
| 2019 | $6,520 | $220,399 | $25,596 | $194,803 |
| 2018 | $3,365 | $216,432 | $19,624 | $196,808 |
| 2017 | $5,581 | $187,269 | $16,637 | $170,632 |
| 2016 | $5,603 | $188,000 | $16,637 | $171,363 |
| 2015 | $4,755 | $170,400 | $16,637 | $153,763 |
| 2014 | $4,755 | $165,296 | $16,637 | $148,659 |
Source: Public Records
Map
Nearby Homes
- 3011 Matador Ranch Trail
- 3027 Matador Ranch Trail
- 3015 Foley Rd
- 3303 Indian Mound Trail
- 18402 Steele Point Dr
- 18226 Steele Point Dr
- 3007 Matador Ranch Trail
- 3003 Matador Ranch Trail
- Julian Plan at Sundance Cove - Paintbrush Collection
- Salinas Plan at Sundance Cove - Paintbrush Collection
- Dawson Plan at Sundance Cove - Paintbrush Collection
- Templeton Plan at Sundance Cove - Paintbrush Collection
- Arpa Plan at Sundance Cove - Paintbrush Collection
- Harding Plan at Sundance Cove - Paintbrush Collection
- 18334 Steele Point Dr
- 2922 Indian Mound Trail
- 18222 Steele Point Dr
- 2731 Rapho St
- 18411 Bluffview Dr
- 18735 Etta Pines Cir
- 3123 Foley Rd
- 3118 Deep Anchor Way
- 3119 Foley Rd
- 3127 Foley Rd
- 3127 Deep Anchor Way
- 3114 Deep Anchor Way
- 3202 Deep Anchor Way
- 3115 Foley Rd
- 3119 Deep Anchor Way
- 3203 Foley Rd
- 3110 Deep Anchor Way
- 3203 Deep Anchor Way
- 3203 Deep Anchor Way
- 3206 Deep Anchor Way
- 3206 Deep Anchor Way
- 3207 Foley Rd
- 3134 Indian Mound Trail
- 18502 Pipestem
- 3111 Deep Anchor Way
- 3126 Indian Mound Trail