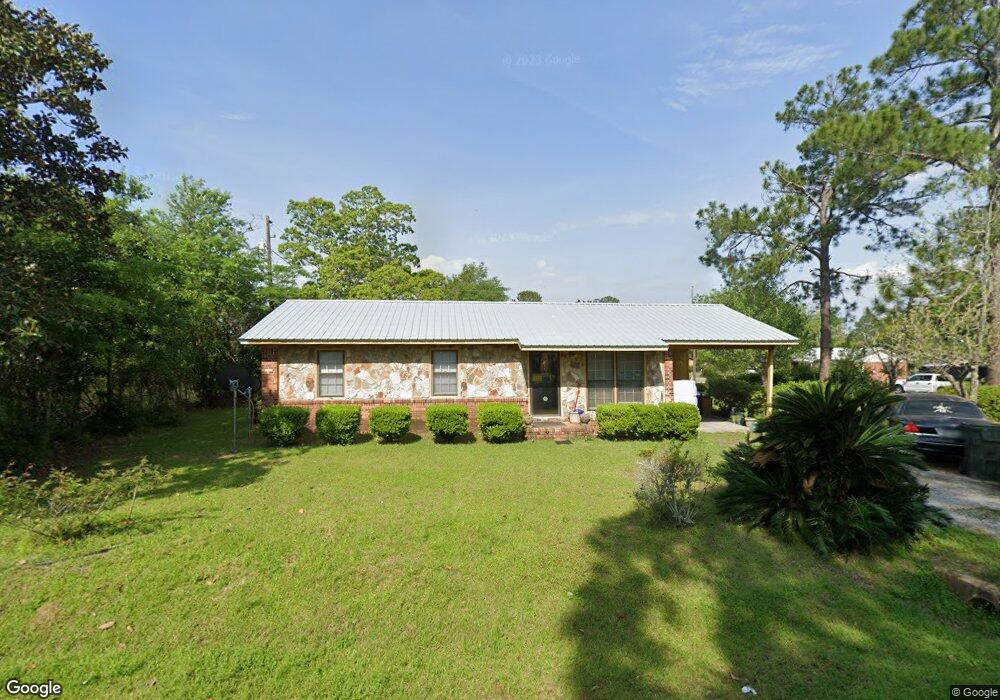
3126 Hillcrest Ave Tifton, GA 31794
Estimated Value: $71,000 - $74,205
3
Beds
1
Bath
1,025
Sq Ft
$71/Sq Ft
Est. Value
About This Home
This home is located at 3126 Hillcrest Ave, Tifton, GA 31794 and is currently estimated at $73,068, approximately $71 per square foot. 3126 Hillcrest Ave is a home located in Tift County with nearby schools including J.T. Reddick School, Matt Wilson Elementary School, and Annie Belle Clark Primary School.
Ownership History
Date
Name
Owned For
Owner Type
Purchase Details
Closed on
Jun 17, 2025
Sold by
Johnson Kodi
Bought by
Roberts Sylvia Johnson
Current Estimated Value
Purchase Details
Closed on
Jun 14, 2025
Sold by
Johnson Aubrey
Bought by
Roberts Sylvia Johnson
Purchase Details
Closed on
Apr 29, 2025
Sold by
Johnson Tiffany
Bought by
Johnson Roberts Sylvia
Purchase Details
Closed on
Mar 6, 2025
Sold by
Mckennon Barbara
Bought by
Johnson Roberts Sylvia
Purchase Details
Closed on
Feb 4, 2025
Sold by
Johnson Latonya
Bought by
Johnson Roberts Sylvia
Purchase Details
Closed on
Jul 9, 1974
Sold by
Secretary Of Housing & Urban Development
Bought by
Johnson Claude and Johnson Annie M
Purchase Details
Closed on
Jun 27, 1972
Sold by
Car-Bro Inc
Bought by
Cherry Wilbert Lee and Cherry Minnie
Create a Home Valuation Report for This Property
The Home Valuation Report is an in-depth analysis detailing your home's value as well as a comparison with similar homes in the area
Home Values in the Area
Average Home Value in this Area
Purchase History
| Date | Buyer | Sale Price | Title Company |
|---|---|---|---|
| Roberts Sylvia Johnson | -- | -- | |
| Roberts Sylvia Johnson | -- | -- | |
| Johnson Roberts Sylvia | -- | -- | |
| Johnson Roberts Sylvia | -- | -- | |
| Johnson Roberts Sylvia | -- | -- | |
| Johnson Roberts Sylvia | -- | -- | |
| Johnson Roberts Sylvia | -- | -- | |
| Johnson Roberts Sylvia | -- | -- | |
| Johnson Roberts Sylvia | -- | -- | |
| Johnson Claude | -- | -- | |
| Cherry Wilbert Lee | -- | -- |
Source: Public Records
Tax History Compared to Growth
Tax History
| Year | Tax Paid | Tax Assessment Tax Assessment Total Assessment is a certain percentage of the fair market value that is determined by local assessors to be the total taxable value of land and additions on the property. | Land | Improvement |
|---|---|---|---|---|
| 2024 | $549 | $25,151 | $1,100 | $24,051 |
| 2023 | $596 | $20,306 | $2,000 | $18,306 |
| 2022 | $603 | $20,306 | $2,000 | $18,306 |
| 2021 | $606 | $20,306 | $2,000 | $18,306 |
| 2020 | $618 | $20,306 | $2,000 | $18,306 |
| 2019 | $617 | $20,306 | $2,000 | $18,306 |
| 2018 | $616 | $20,306 | $2,000 | $18,306 |
| 2017 | $619 | $20,306 | $2,000 | $18,306 |
| 2016 | $619 | $20,306 | $2,000 | $18,306 |
| 2015 | $619 | $20,306 | $2,000 | $18,306 |
| 2014 | $621 | $20,306 | $2,000 | $18,306 |
| 2013 | -- | $20,306 | $2,000 | $18,306 |
Source: Public Records
Map
Nearby Homes
- 2906 S Park Ave
- 2729 Central Ave S
- 0 Union Rd
- 604 Golden Rd W
- 2901 3rd Ave
- 4108 Plaza Dr
- 4480 Union Rd
- 1911 Park Ave S
- 1910 Park Ave S
- 603 21st St W
- 100 Palmetta Rd
- 0 Jordan Rd
- 64 Palmetta Rd
- 614/620 Old Omega Rd
- 311 11th St
- 13 Amoco Rd
- 0 Georgia 125
- 18 Tifton Eldorado Rd
- 111 Virginia Ave
- 17 Waters Edge Way
- 3124 Hillcrest Ave
- 3122 Hillcrest Ave
- 3127 Lincoln Dr
- 3129 Hillcrest Ave
- 3125 Hillcrest Ave
- 3109 Lincoln Dr
- 3120 Hillcrest Ave
- 3106 Lincoln Dr
- 3123 Hillcrest Ave
- 3107 Lincoln Dr
- 3128 Hillcrest Ave
- 3112 King Dr
- 3114 King Dr
- 3110 King Dr
- 3118 Hillcrest Ave
- 3130 Hillcrest Ave
- 3121 Hillcrest Ave
- 3104 Lincoln Dr
- 3108 King Dr
- 3105 Lincoln Dr