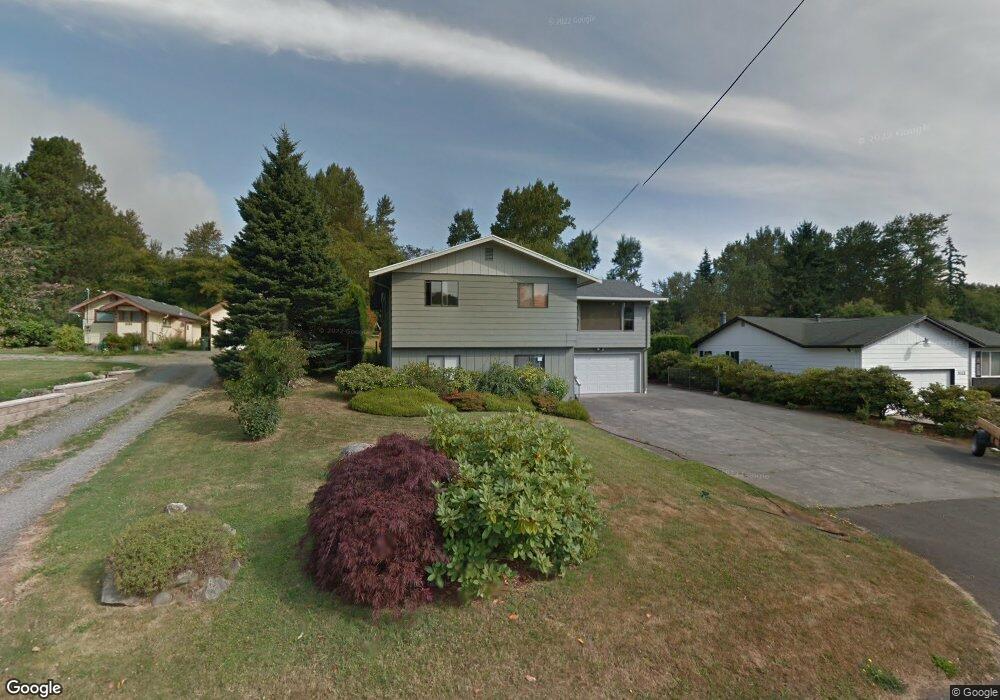
3126 Mcleod Rd Bellingham, WA 98225
Birchwood NeighborhoodEstimated Value: $661,000 - $772,393
5
Beds
3
Baths
2,427
Sq Ft
$294/Sq Ft
Est. Value
About This Home
This home is located at 3126 Mcleod Rd, Bellingham, WA 98225 and is currently estimated at $713,348, approximately $293 per square foot. 3126 Mcleod Rd is a home located in Whatcom County with nearby schools including Alderwood Elementary School, Shuksan Middle School, and Squalicum High School.
Ownership History
Date
Name
Owned For
Owner Type
Purchase Details
Closed on
Feb 8, 2005
Sold by
Moisey Jane E
Bought by
Flaherty Dennis G and Hunt Elizabeth
Current Estimated Value
Home Financials for this Owner
Home Financials are based on the most recent Mortgage that was taken out on this home.
Original Mortgage
$280,700
Outstanding Balance
$149,651
Interest Rate
6.5%
Mortgage Type
Purchase Money Mortgage
Estimated Equity
$563,697
Purchase Details
Closed on
Aug 13, 2002
Sold by
Moisey Stanley G and Moisey Christine M
Bought by
Moisey Christine M
Purchase Details
Closed on
Nov 21, 2000
Sold by
Haynes James D and Haynes Twyla M
Bought by
Moisey Stanley G and Moisey Christine M
Home Financials for this Owner
Home Financials are based on the most recent Mortgage that was taken out on this home.
Original Mortgage
$168,400
Interest Rate
7.37%
Create a Home Valuation Report for This Property
The Home Valuation Report is an in-depth analysis detailing your home's value as well as a comparison with similar homes in the area
Home Values in the Area
Average Home Value in this Area
Purchase History
| Date | Buyer | Sale Price | Title Company |
|---|---|---|---|
| Flaherty Dennis G | $295,500 | First American Title Insuran | |
| Moisey Christine M | -- | -- | |
| Moisey Stanley G | -- | -- | |
| Moisey Stanley G | $210,500 | Whatcom Land Title |
Source: Public Records
Mortgage History
| Date | Status | Borrower | Loan Amount |
|---|---|---|---|
| Open | Flaherty Dennis G | $280,700 | |
| Previous Owner | Moisey Stanley G | $168,400 |
Source: Public Records
Tax History Compared to Growth
Tax History
| Year | Tax Paid | Tax Assessment Tax Assessment Total Assessment is a certain percentage of the fair market value that is determined by local assessors to be the total taxable value of land and additions on the property. | Land | Improvement |
|---|---|---|---|---|
| 2024 | $5,582 | $687,135 | $231,228 | $455,907 |
| 2023 | $5,582 | $717,349 | $241,395 | $475,954 |
| 2022 | $4,830 | $629,253 | $211,750 | $417,503 |
| 2021 | $4,189 | $520,044 | $175,000 | $345,044 |
| 2020 | $4,049 | $425,630 | $116,828 | $308,802 |
| 2019 | $3,622 | $397,640 | $109,238 | $288,402 |
| 2018 | $3,748 | $356,654 | $97,988 | $258,666 |
| 2017 | $3,259 | $315,570 | $86,700 | $228,870 |
| 2016 | $2,983 | $286,757 | $78,900 | $207,857 |
| 2015 | $2,989 | $273,242 | $75,000 | $198,242 |
| 2014 | -- | $264,902 | $72,240 | $192,662 |
| 2013 | -- | $253,444 | $70,000 | $183,444 |
Source: Public Records
Map
Nearby Homes
- 3057 Mcleod Rd
- 3085 W Maplewood Ave
- 3635 Home Rd
- 3410 Forest Ct
- 0 Home Ln
- 2850 W Maplewood Ave
- 2817 Mcleod Rd
- 3333 Redwood Ave Unit 9
- 2833 Mcleod Rd
- 2829 Cottonwood Ave
- 589 Spring Dr
- 1217 Garland Ln
- 3333 Hollywood Ave
- 4015 Eliza Ave Unit 31
- 4015 Eliza Ave Unit 120
- 4015 Eliza Ave Unit 47
- 44 XX Pacific Hwy
- 4154 Pacific Hwy
- 1210 Mahogany Ave
- 1365 Mahogany Ave
- 3122 Mcleod Rd
- 3136 Mcleod Rd
- 3118 Mcleod Rd
- 3129 Mcleod Rd
- 3135 Mcleod Rd
- 3114 Mcleod Rd
- 3202 Mcleod Rd
- 3139 Mcleod Rd
- 3111 Mcleod Rd
- 3110 Mcleod Rd
- 3206 Mcleod Rd
- 3109 Mcleod Rd
- 3201 Mcleod Rd
- 3105 Mcleod Rd
- 3108 Mcleod Rd
- 3101 Mcleod Rd
- 3207 Mcleod Rd
- 3019 W Maplewood Ave
- 3218 Mcleod Rd
- 1399 Bradley Ln