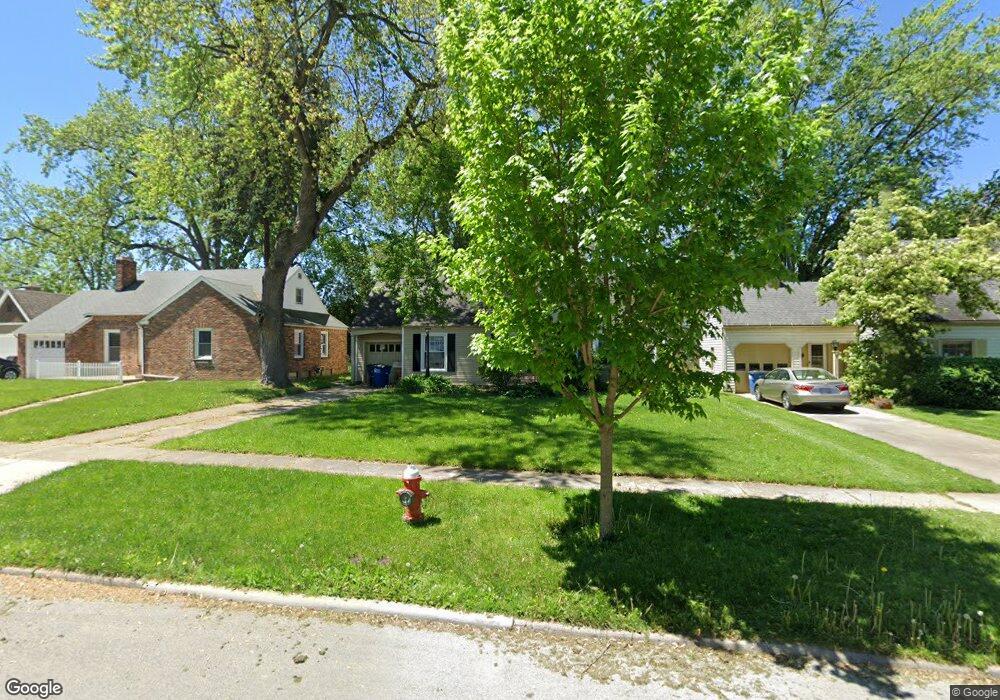
3127 Cheltenham Rd Toledo, OH 43606
Westgate NeighborhoodEstimated Value: $188,000 - $233,000
3
Beds
2
Baths
1,620
Sq Ft
$129/Sq Ft
Est. Value
About This Home
This home is located at 3127 Cheltenham Rd, Toledo, OH 43606 and is currently estimated at $208,493, approximately $128 per square foot. 3127 Cheltenham Rd is a home located in Lucas County with nearby schools including Old Orchard Elementary School, Start High School, and Discovery Academy.
Ownership History
Date
Name
Owned For
Owner Type
Purchase Details
Closed on
Jan 15, 2004
Sold by
Gnepper Robert R and Gnepper Colleen M
Bought by
Schroeder Mark A and Schroeder Melissa M
Current Estimated Value
Home Financials for this Owner
Home Financials are based on the most recent Mortgage that was taken out on this home.
Original Mortgage
$123,322
Outstanding Balance
$58,392
Interest Rate
6.08%
Mortgage Type
FHA
Estimated Equity
$150,101
Purchase Details
Closed on
Apr 30, 1998
Sold by
Fedurek Geoffrey A
Bought by
Gnepper Robert R and Gnepper Colleen M
Home Financials for this Owner
Home Financials are based on the most recent Mortgage that was taken out on this home.
Original Mortgage
$90,725
Interest Rate
7.18%
Purchase Details
Closed on
Mar 8, 1996
Sold by
Cowper Shawn E
Bought by
Fedurek Geoffrey A
Purchase Details
Closed on
Sep 5, 1991
Sold by
Edwards Patricia A
Purchase Details
Closed on
Feb 23, 1989
Sold by
Piel Charlene L
Create a Home Valuation Report for This Property
The Home Valuation Report is an in-depth analysis detailing your home's value as well as a comparison with similar homes in the area
Home Values in the Area
Average Home Value in this Area
Purchase History
| Date | Buyer | Sale Price | Title Company |
|---|---|---|---|
| Schroeder Mark A | $135,000 | First Capital | |
| Gnepper Robert R | $95,500 | -- | |
| Fedurek Geoffrey A | $80,000 | -- | |
| -- | $73,900 | -- | |
| -- | $56,800 | -- |
Source: Public Records
Mortgage History
| Date | Status | Borrower | Loan Amount |
|---|---|---|---|
| Open | Schroeder Mark A | $123,322 | |
| Closed | Gnepper Robert R | $90,725 | |
| Closed | Fedurek Geoffrey A | -- |
Source: Public Records
Tax History Compared to Growth
Tax History
| Year | Tax Paid | Tax Assessment Tax Assessment Total Assessment is a certain percentage of the fair market value that is determined by local assessors to be the total taxable value of land and additions on the property. | Land | Improvement |
|---|---|---|---|---|
| 2024 | $1,349 | $43,890 | $12,845 | $31,045 |
| 2023 | $2,830 | $44,520 | $12,495 | $32,025 |
| 2022 | $2,834 | $44,520 | $12,495 | $32,025 |
| 2021 | $2,904 | $44,520 | $12,495 | $32,025 |
| 2020 | $2,729 | $36,855 | $10,360 | $26,495 |
| 2019 | $2,656 | $36,855 | $10,360 | $26,495 |
| 2018 | $2,677 | $36,855 | $10,360 | $26,495 |
| 2017 | $2,732 | $36,015 | $10,115 | $25,900 |
| 2016 | $2,723 | $102,900 | $28,900 | $74,000 |
| 2015 | $2,695 | $102,900 | $28,900 | $74,000 |
| 2014 | $2,265 | $36,020 | $10,120 | $25,900 |
| 2013 | $2,265 | $36,020 | $10,120 | $25,900 |
Source: Public Records
Map
Nearby Homes
- 3115 Drummond Rd
- 3010 W Central Ave
- 2838 Meadowwood Dr
- 3433 Goddard Rd
- 3031 Douglas Rd
- 2713 Meadowwood Dr
- 3538 Grantley Rd
- 3350 Wyckliffe Pkwy
- 3512 Rushland Ave
- 2927 Sherbrooke Rd
- 3512 Wyckliffe Pkwy
- 2824 Secor Rd
- 2719 Letchworth Pkwy
- 3646 Garrison Rd
- 3037 Sherbrooke Rd
- 2541 Cheltenham Rd
- 2647 Pemberton Dr
- 2627 Latonia Blvd
- 2503 Goddard Rd
- 2953 Darlington Rd
- 3121 Cheltenham Rd
- 3133 Cheltenham Rd
- 3115 Cheltenham Rd
- 3139 Cheltenham Rd
- 3128 Goddard Rd
- 3132 Goddard Rd
- 3124 Goddard Rd
- 3136 Goddard Rd
- 3120 Goddard Rd
- 3140 Goddard Rd
- 3109 Cheltenham Rd
- 3145 Cheltenham Rd
- 3128 Cheltenham Rd
- 3116 Goddard Rd
- 3122 Cheltenham Rd
- 3144 Goddard Rd
- 3116 Cheltenham Rd
- 3151 Cheltenham Rd
- 3144 Cheltenham Rd
- 3150 Goddard Rd