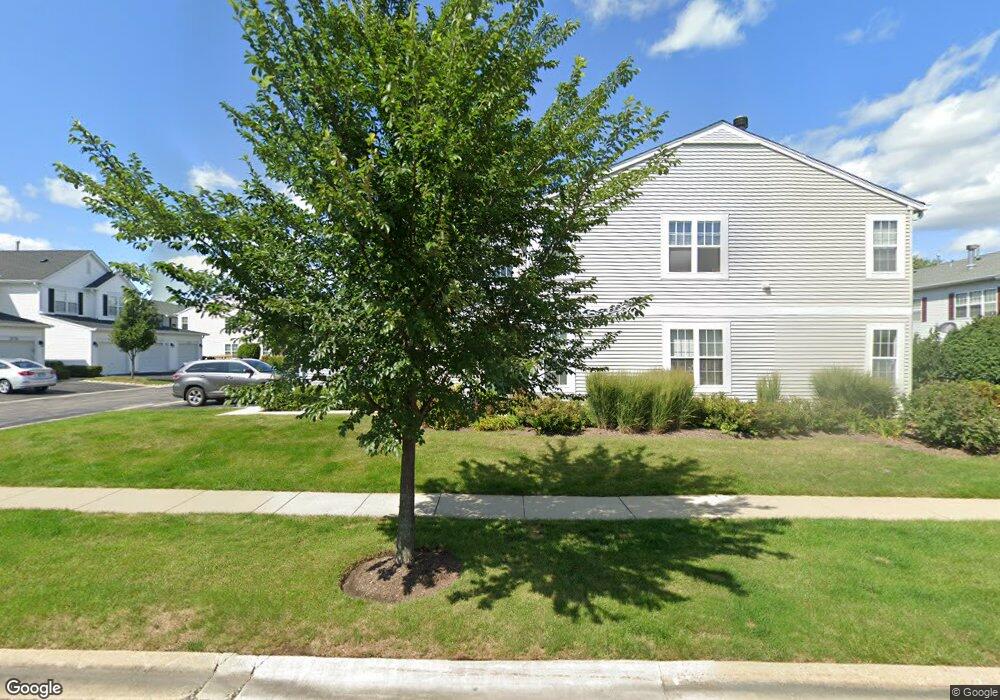
3127 Falling Waters Ln Lindenhurst, IL 60046
Estimated Value: $209,107 - $236,000
2
Beds
2
Baths
1,203
Sq Ft
$187/Sq Ft
Est. Value
About This Home
This home is located at 3127 Falling Waters Ln, Lindenhurst, IL 60046 and is currently estimated at $225,027, approximately $187 per square foot. 3127 Falling Waters Ln is a home located in Lake County with nearby schools including Millburn Elementary School, Millburn Middle School, and Grayslake North High School.
Ownership History
Date
Name
Owned For
Owner Type
Purchase Details
Closed on
Apr 12, 2021
Sold by
Cipolla Charles and Cipolla Mary
Bought by
Cipolla Revocable Living Trust and Cipolla
Current Estimated Value
Purchase Details
Closed on
Aug 6, 2020
Sold by
Cipolla Charles P and Cipolla Mary K
Bought by
Cipolla Charles P and Cipolla Mary K
Home Financials for this Owner
Home Financials are based on the most recent Mortgage that was taken out on this home.
Original Mortgage
$100,000
Interest Rate
3.87%
Mortgage Type
New Conventional
Purchase Details
Closed on
Jan 13, 2016
Sold by
Schenkenberg Terry M
Bought by
Cipolla Charles
Home Financials for this Owner
Home Financials are based on the most recent Mortgage that was taken out on this home.
Original Mortgage
$89,600
Interest Rate
4.75%
Mortgage Type
New Conventional
Purchase Details
Closed on
Nov 10, 2015
Sold by
Schenkenberg Terry M
Bought by
The Terry M Schenkenberg Trust
Purchase Details
Closed on
Oct 10, 2014
Sold by
Kleckner Calvin C
Bought by
Schenkenberg Terry M
Home Financials for this Owner
Home Financials are based on the most recent Mortgage that was taken out on this home.
Original Mortgage
$87,000
Interest Rate
4.08%
Mortgage Type
New Conventional
Purchase Details
Closed on
Apr 21, 2006
Sold by
Hoke David C and Hoke Cheryl A
Bought by
Kleckner Calvin C
Home Financials for this Owner
Home Financials are based on the most recent Mortgage that was taken out on this home.
Original Mortgage
$127,200
Interest Rate
6.39%
Mortgage Type
Fannie Mae Freddie Mac
Purchase Details
Closed on
Jul 30, 2004
Sold by
Miller Jacqueline A and Miller Mary Ann
Bought by
Hoke David C and Hoke Cheryl A
Home Financials for this Owner
Home Financials are based on the most recent Mortgage that was taken out on this home.
Original Mortgage
$130,500
Interest Rate
5.37%
Mortgage Type
Unknown
Purchase Details
Closed on
Dec 23, 2002
Sold by
Miller Jacqueline A
Bought by
Miller Jacqueline A and Miller Mary Ann
Home Financials for this Owner
Home Financials are based on the most recent Mortgage that was taken out on this home.
Original Mortgage
$136,000
Interest Rate
5.96%
Mortgage Type
FHA
Purchase Details
Closed on
Mar 24, 2000
Sold by
Pinnacle Corp
Bought by
Miller Jacqueline A and Miller Mary Ann
Home Financials for this Owner
Home Financials are based on the most recent Mortgage that was taken out on this home.
Original Mortgage
$111,800
Interest Rate
8.29%
Create a Home Valuation Report for This Property
The Home Valuation Report is an in-depth analysis detailing your home's value as well as a comparison with similar homes in the area
Home Values in the Area
Average Home Value in this Area
Purchase History
| Date | Buyer | Sale Price | Title Company |
|---|---|---|---|
| Cipolla Revocable Living Trust | -- | None Listed On Document | |
| Cipolla Charles P | -- | Avenue 365 Lender Svcs Llc | |
| Cipolla Charles | $112,000 | Attorney | |
| The Terry M Schenkenberg Trust | -- | Attorney | |
| Schenkenberg Terry M | $112,000 | Fidelity Natl Title Ins Co | |
| Kleckner Calvin C | $159,000 | None Available | |
| Hoke David C | $145,000 | -- | |
| Miller Jacqueline A | -- | Stewart Title Company | |
| Miller Jacqueline A | -- | Stewart Title Guaranty Compa | |
| Miller Jacqueline A | $120,000 | Chicago Title Insurance Co |
Source: Public Records
Mortgage History
| Date | Status | Borrower | Loan Amount |
|---|---|---|---|
| Previous Owner | Cipolla Charles P | $100,000 | |
| Previous Owner | Cipolla Charles | $89,600 | |
| Previous Owner | Schenkenberg Terry M | $87,000 | |
| Previous Owner | Kleckner Calvin C | $127,200 | |
| Previous Owner | Hoke David C | $130,500 | |
| Previous Owner | Miller Jacqueline A | $136,000 | |
| Previous Owner | Miller Jacqueline A | $111,800 |
Source: Public Records
Tax History
| Year | Tax Paid | Tax Assessment Tax Assessment Total Assessment is a certain percentage of the fair market value that is determined by local assessors to be the total taxable value of land and additions on the property. | Land | Improvement |
|---|---|---|---|---|
| 2024 | $3,843 | $55,294 | $9,616 | $45,678 |
| 2023 | $4,769 | $48,855 | $8,496 | $40,359 |
| 2022 | $4,769 | $45,114 | $7,834 | $37,280 |
| 2021 | $4,561 | $41,908 | $7,277 | $34,631 |
| 2020 | $4,522 | $40,565 | $7,044 | $33,521 |
| 2019 | $4,288 | $38,986 | $6,770 | $32,216 |
| 2018 | $4,142 | $34,183 | $5,678 | $28,505 |
| 2017 | $4,043 | $33,272 | $5,527 | $27,745 |
| 2016 | $4,027 | $31,925 | $5,303 | $26,622 |
| 2015 | $3,844 | $29,817 | $4,953 | $24,864 |
| 2014 | $4,122 | $27,211 | $4,926 | $22,285 |
| 2012 | $4,764 | $27,342 | $4,950 | $22,392 |
Source: Public Records
Map
Nearby Homes
- 817 Blue Spruce Ct
- 961 Sumac Ct
- 2813 Spring Cir S
- 2798 Spring Cir S
- 2792 Spring Cir S
- 40 U S 45
- 36879 N Deerview Dr
- 36856 N Deer Trail Dr
- 2303 Neubauer Cir Unit 312
- 2711 Neubauer Cir Unit 336
- 3210 Neubauer Cir
- 206 Neubauer Cir Unit 1601
- 402 Neubauer Cir
- 1406 Neubauer Cir Unit 1904
- 19414 W Grand Ave
- 710 Greenbriar Ln
- 18637 W Karen Ln
- 2407 Valley Dr
- 200 S Beck Rd Unit 12
- 36225 N Us Highway 45
- 3135 Falling Waters Ln
- 3133 Falling Waters Ln
- 3131 Falling Waters Ln
- 3125 Falling Waters Ln
- 3127 Falling Waters Ln Unit 3127
- 3137 Falling Waters Ln
- 3139 Falling Waters Ln
- 3141 Falling Waters Ln
- 3143 Falling Waters Ln
- 3145 Falling Waters Ln
- 3141 Falling Waters Ln Unit 3141
- 3139 Falling Waters Ln
- 2901 Falling Waters Dr
- 2901 Falling Waters Dr Unit 2901
- 3113 Falling Waters Ln
- 3115 Falling Waters Ln
- 3117 Falling Waters Ln
- 3119 Falling Waters Ln
- 3121 Falling Waters Ln
- 3123 Falling Waters Ln
Your Personal Tour Guide
Ask me questions while you tour the home.