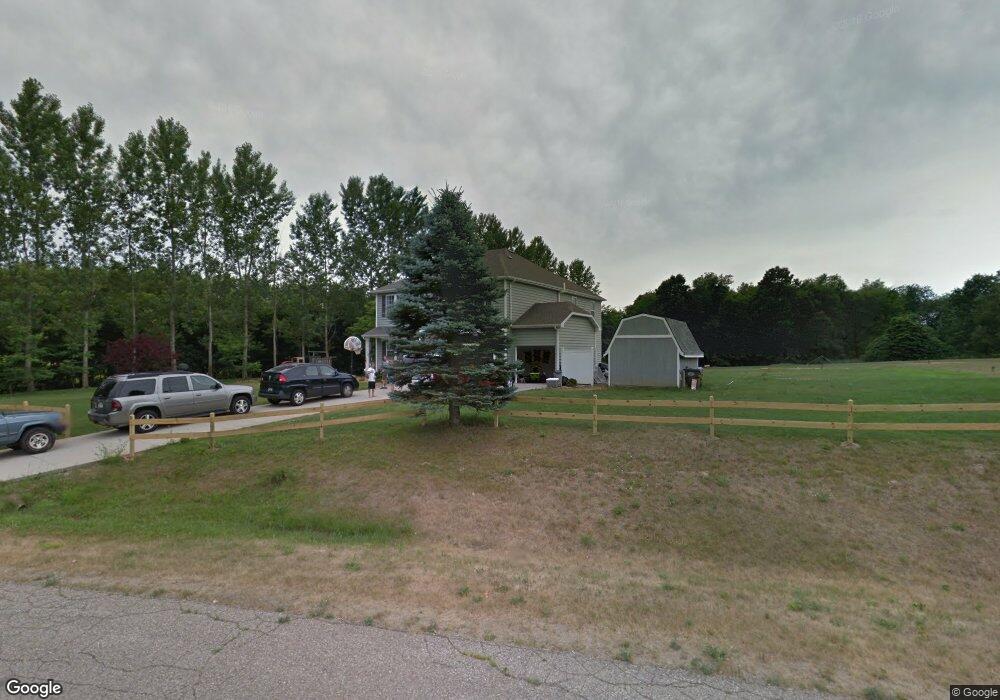
31278 Hidden Pines Dr Paw Paw, MI 49079
Estimated Value: $486,000 - $626,000
--
Bed
1
Bath
3,064
Sq Ft
$192/Sq Ft
Est. Value
About This Home
This home is located at 31278 Hidden Pines Dr, Paw Paw, MI 49079 and is currently estimated at $587,566, approximately $191 per square foot. 31278 Hidden Pines Dr is a home located in Van Buren County with nearby schools including Paw Paw Early Elementary School, Paw Paw Later Elementary School, and Paw Paw Middle School.
Ownership History
Date
Name
Owned For
Owner Type
Purchase Details
Closed on
May 2, 2011
Sold by
Darner Larry and Darner Karen J
Bought by
Redmond Kelly S and Redmond Heather L
Current Estimated Value
Purchase Details
Closed on
Mar 6, 2008
Sold by
Dillenbeck Jeffrey and Dillenbeck Allison S
Bought by
Redmond Kelly S and Redmond Heather L
Purchase Details
Closed on
Oct 18, 2005
Sold by
Jewell John and Jewell Cindy
Bought by
Dillenbeck Jeffrey
Home Financials for this Owner
Home Financials are based on the most recent Mortgage that was taken out on this home.
Original Mortgage
$25,600
Interest Rate
5.8%
Mortgage Type
Fannie Mae Freddie Mac
Purchase Details
Closed on
Dec 7, 2004
Sold by
Henry Marvin L and Henry Ronald
Bought by
Jewell John and Jewell Cindy
Create a Home Valuation Report for This Property
The Home Valuation Report is an in-depth analysis detailing your home's value as well as a comparison with similar homes in the area
Home Values in the Area
Average Home Value in this Area
Purchase History
| Date | Buyer | Sale Price | Title Company |
|---|---|---|---|
| Redmond Kelly S | $4,000 | None Available | |
| Redmond Kelly S | $32,500 | Chicago Title | |
| Dillenbeck Jeffrey | $32,000 | -- | |
| Jewell John | $25,000 | -- | |
| Jewell John | -- | -- |
Source: Public Records
Mortgage History
| Date | Status | Borrower | Loan Amount |
|---|---|---|---|
| Previous Owner | Jewell John | $25,600 |
Source: Public Records
Tax History Compared to Growth
Tax History
| Year | Tax Paid | Tax Assessment Tax Assessment Total Assessment is a certain percentage of the fair market value that is determined by local assessors to be the total taxable value of land and additions on the property. | Land | Improvement |
|---|---|---|---|---|
| 2025 | $2,148 | $336,400 | $0 | $0 |
| 2024 | $2,148 | $290,800 | $0 | $0 |
| 2023 | $2,046 | $269,000 | $0 | $0 |
| 2022 | $6,320 | $241,100 | $0 | $0 |
| 2021 | $5,946 | $223,900 | $16,500 | $207,400 |
| 2020 | $5,946 | $223,900 | $16,500 | $207,400 |
| 2019 | $5,667 | $200,500 | $200,500 | $0 |
| 2018 | $5,364 | $183,900 | $183,900 | $0 |
| 2017 | $5,257 | $182,700 | $0 | $0 |
| 2016 | $5,224 | $173,200 | $0 | $0 |
| 2015 | $4,683 | $173,200 | $0 | $0 |
| 2014 | $4,446 | $158,300 | $0 | $0 |
| 2013 | -- | $187,900 | $187,900 | $0 |
Source: Public Records
Map
Nearby Homes
- 31278 Hidden Pines Dr
- 31080 Hidden Pines
- 31080 Hidden Pines Dr
- 31639 Hidden Pines Dr
- 31639 Hidden Pines Dr
- 30153 Hidden Pines Dr
- 30166 Hidden Pines Dr
- 31878 M 43
- 2 Hidden Pines Dr
- 7 Hidden Pines Dr
- 31955 Hidden Pines Dr
- 0 Hidden Pines Dr
- 30945 Hidden Pines
- 32080 M 43
- 30945 Hidden Pines Dr
- 31896 Michigan 43
- 30744 Hidden Pines Dr
- 31896 M 43
- 30765 Hidden Pines Dr
- 32246 M 43