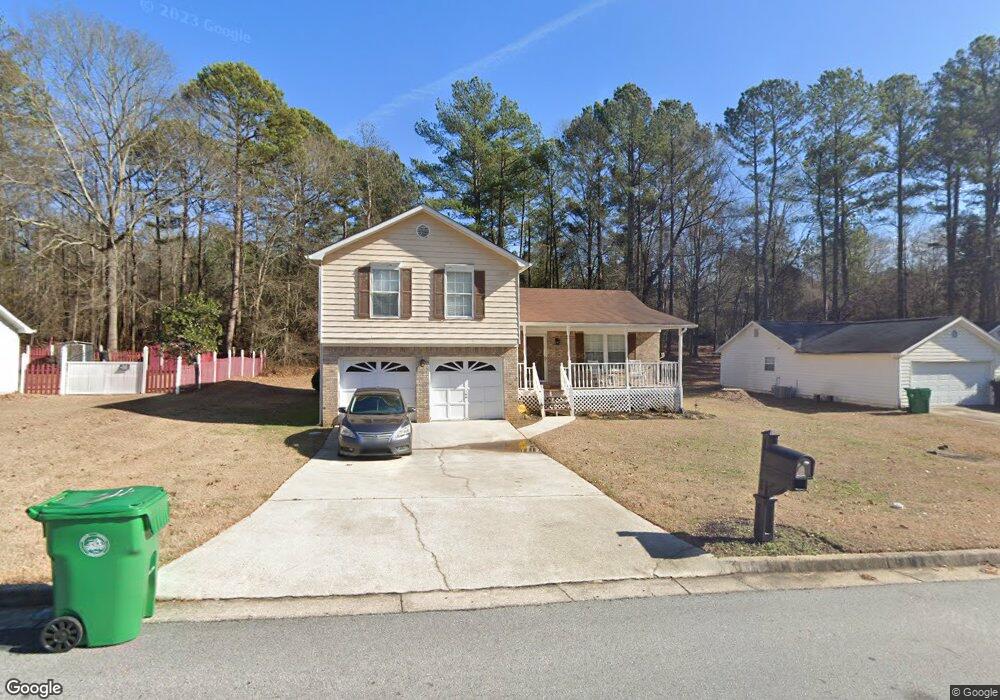
3128 Aberdeen Way Lithonia, GA 30038
Estimated Value: $236,000 - $277,000
3
Beds
3
Baths
1,675
Sq Ft
$148/Sq Ft
Est. Value
About This Home
This home is located at 3128 Aberdeen Way, Lithonia, GA 30038 and is currently estimated at $247,760, approximately $147 per square foot. 3128 Aberdeen Way is a home located in DeKalb County with nearby schools including Flat Rock Elementary School, Salem Middle School, and Martin Luther King- Jr. High School.
Ownership History
Date
Name
Owned For
Owner Type
Purchase Details
Closed on
Apr 25, 2009
Sold by
Ramsy Lucretia
Bought by
Haugabook Aaesha
Current Estimated Value
Home Financials for this Owner
Home Financials are based on the most recent Mortgage that was taken out on this home.
Original Mortgage
$87,387
Outstanding Balance
$54,856
Interest Rate
4.81%
Mortgage Type
FHA
Estimated Equity
$192,904
Purchase Details
Closed on
Jul 1, 2008
Sold by
Bank Of Ny Trust Co Na
Bought by
Ramsey Lucretia
Purchase Details
Closed on
Apr 1, 2008
Sold by
Carmichael Trudie E
Bought by
Bank Of New York Trust Co Na
Purchase Details
Closed on
May 18, 1994
Sold by
Bethel Prop
Bought by
Carmichael Trudie E
Home Financials for this Owner
Home Financials are based on the most recent Mortgage that was taken out on this home.
Original Mortgage
$83,900
Interest Rate
8.48%
Create a Home Valuation Report for This Property
The Home Valuation Report is an in-depth analysis detailing your home's value as well as a comparison with similar homes in the area
Home Values in the Area
Average Home Value in this Area
Purchase History
| Date | Buyer | Sale Price | Title Company |
|---|---|---|---|
| Haugabook Aaesha | $89,000 | -- | |
| Ramsey Lucretia | $79,000 | -- | |
| Bank Of New York Trust Co Na | $98,806 | -- | |
| Carmichael Trudie E | $85,900 | -- |
Source: Public Records
Mortgage History
| Date | Status | Borrower | Loan Amount |
|---|---|---|---|
| Open | Haugabook Aaesha | $87,387 | |
| Previous Owner | Carmichael Trudie E | $83,900 |
Source: Public Records
Tax History Compared to Growth
Tax History
| Year | Tax Paid | Tax Assessment Tax Assessment Total Assessment is a certain percentage of the fair market value that is determined by local assessors to be the total taxable value of land and additions on the property. | Land | Improvement |
|---|---|---|---|---|
| 2025 | $2,711 | $98,120 | $20,000 | $78,120 |
| 2024 | $2,833 | $101,720 | $20,000 | $81,720 |
| 2023 | $2,833 | $80,040 | $4,520 | $75,520 |
| 2022 | $2,082 | $73,600 | $4,520 | $69,080 |
| 2021 | $1,691 | $55,920 | $4,520 | $51,400 |
| 2020 | $1,545 | $50,040 | $4,520 | $45,520 |
| 2019 | $1,551 | $49,680 | $4,520 | $45,160 |
| 2018 | $1,253 | $39,840 | $4,520 | $35,320 |
| 2017 | $1,223 | $35,800 | $4,520 | $31,280 |
| 2016 | $1,198 | $35,880 | $4,520 | $31,360 |
| 2014 | $630 | $19,200 | $4,480 | $14,720 |
Source: Public Records
Map
Nearby Homes
- 5614 Regency Forest Ct
- 3287 Pennington Dr
- 3015 Bonnes Dr
- 5891 Cassie Dr
- 5919 Cassie Dr
- 3255 Hunters Crossing Point
- 3310 Pennington Dr
- 5548 Halsted Way
- 5873 Taka Ln
- 5843 Taka Ln
- 5585 Fairington Place
- 3027 Fair Creek Ct
- 3406 Pennington Dr
- 3147 Bonnes Dr
- 5600 Rock Springs Rd
- 3248 Brisbane Way
- 5536 La Fleur Trail
- 2700 Norfair Loop
- 3026 Highland Park Ln Unit II
- 2892 Norfair Loop
- 3120 Aberdeen Way Unit 2
- 3136 Aberdeen Way
- 5631 Regency Manor Ct
- 3114 Aberdeen Way Unit 2
- 3142 Aberdeen Way
- 3133 Aberdeen Way
- 3099 Regency Park Dr
- 5623 Regency Manor Ct Unit 2
- 5628 Regency Manor Ct
- 3108 Aberdeen Way
- 3150 Aberdeen Way
- 3107 Regency Park Dr
- 3109 Aberdeen Way
- 5622 Regency Manor Ct
- 5617 Regency Manor Ct
- 3156 Aberdeen Way Unit 883
- 3156 Aberdeen Way
- 3100 Aberdeen Way
- 3153 Aberdeen Way Unit 1
- 3115 Regency Park Dr