Estimated Value: $335,000 - $369,000
3
Beds
2
Baths
1,452
Sq Ft
$241/Sq Ft
Est. Value
About This Home
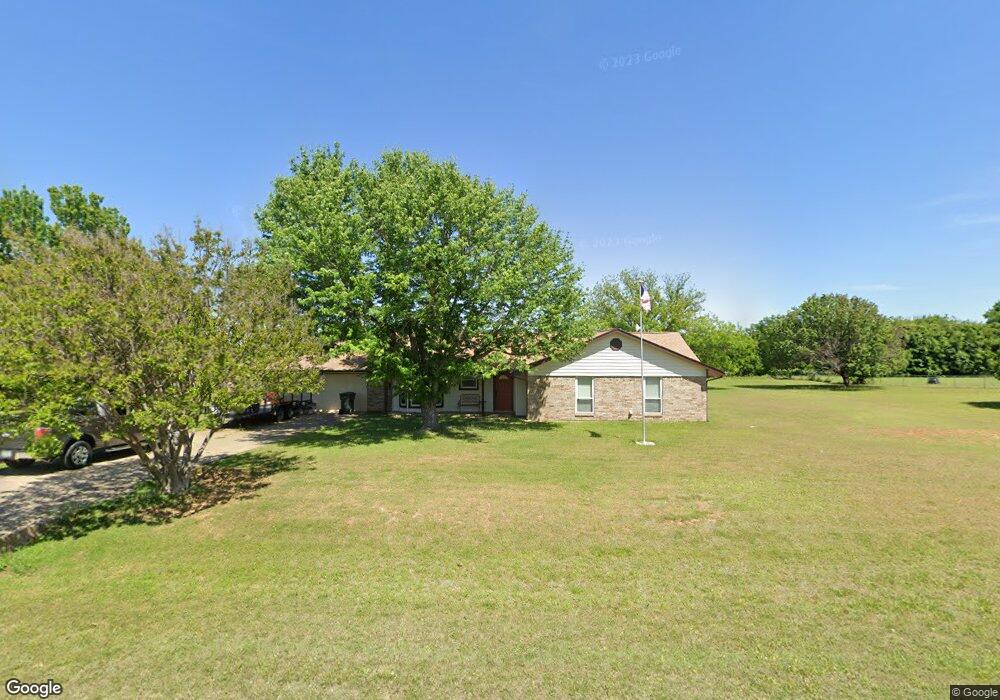
This home is located at 3128 English Creek Dr, Azle, TX 76020 and is currently estimated at $350,117, approximately $241 per square foot. 3128 English Creek Dr is a home located in Tarrant County with nearby schools including Liberty Elementary School, W E Hoover Elementary School, and Santo Forte Junior High School.
Ownership History
Date
Name
Owned For
Owner Type
Purchase Details
Closed on
Nov 13, 2003
Sold by
Hartzell Michael W and Hartzell Blanche A
Bought by
Sanford Steven C and Sanford Patricia A
Current Estimated Value
Home Financials for this Owner
Home Financials are based on the most recent Mortgage that was taken out on this home.
Original Mortgage
$123,322
Outstanding Balance
$56,417
Interest Rate
5.81%
Mortgage Type
Purchase Money Mortgage
Estimated Equity
$293,700
Purchase Details
Closed on
Feb 23, 1998
Sold by
Bradford Debbie Lynn
Bought by
Hartzell Michael W and Hartzell Blanche A
Home Financials for this Owner
Home Financials are based on the most recent Mortgage that was taken out on this home.
Original Mortgage
$89,760
Interest Rate
7.01%
Mortgage Type
VA
Create a Home Valuation Report for This Property
The Home Valuation Report is an in-depth analysis detailing your home's value as well as a comparison with similar homes in the area
Home Values in the Area
Average Home Value in this Area
Purchase History
| Date | Buyer | Sale Price | Title Company |
|---|---|---|---|
| Sanford Steven C | -- | Commonwealth Land Title | |
| Hartzell Michael W | -- | Commerce Land Title Inc |
Source: Public Records
Mortgage History
| Date | Status | Borrower | Loan Amount |
|---|---|---|---|
| Open | Sanford Steven C | $123,322 | |
| Previous Owner | Hartzell Michael W | $89,760 |
Source: Public Records
Tax History Compared to Growth
Tax History
| Year | Tax Paid | Tax Assessment Tax Assessment Total Assessment is a certain percentage of the fair market value that is determined by local assessors to be the total taxable value of land and additions on the property. | Land | Improvement |
|---|---|---|---|---|
| 2025 | $2,591 | $271,533 | $86,445 | $185,088 |
| 2024 | $2,591 | $271,533 | $86,445 | $185,088 |
| 2023 | $3,584 | $273,025 | $86,445 | $186,580 |
| 2022 | $3,798 | $247,215 | $46,445 | $200,770 |
| 2021 | $3,545 | $182,121 | $46,445 | $135,676 |
| 2020 | $3,431 | $178,319 | $41,575 | $136,744 |
| 2019 | $3,245 | $179,387 | $41,575 | $137,812 |
| 2018 | $2,375 | $145,663 | $41,575 | $104,088 |
| 2017 | $2,554 | $150,775 | $41,575 | $109,200 |
| 2016 | $2,322 | $120,381 | $41,675 | $78,706 |
| 2015 | $1,951 | $121,600 | $15,000 | $106,600 |
| 2014 | $1,951 | $121,600 | $15,000 | $106,600 |
Source: Public Records
Map
Nearby Homes
- 12424 Lake Forest Dr
- 7317 Briar Rd
- 12420 Lake Forest Dr
- TBD #16 out of 13345 Briar Rd
- 12215 Lake Forest Dr
- 7765 Reed Rd
- 508 Amory St
- 12210 Lake Forest Dr
- 7425 Hickey Rd
- 7329 Hickey Rd
- 13250 Miller Rd
- 13230 Miller Rd
- 12020 Younger Ct
- 11972 Younger Ct
- 7232 Courtney Dr
- 13350 Miller Rd
- 7145 Hickey Rd
- 13360 Miller Rd
- 6955 Allyn Dr
- 11770 North Ct
- 3140 English Creek Dr
- 3116 English Creek Dr
- 3129 English Creek Dr
- 3148 English Creek Dr
- 3117 English Creek Dr
- 3108 English Creek Dr
- 3109 English Creek Dr
- 3149 English Creek Dr
- 3041 English Creek Dr
- 3040 English Creek Dr
- 3157 English Creek Dr
- 12635 Liberty School Rd
- 824 English Creek Dr
- 3028 English Creek Dr
- 12621 Liberty School Rd
- 3028 English Creek Dr - Azle Beauty
- 3029 English Creek Dr
- 12609 Liberty School Rd
- 3308 English Creek Ct
- 3317 English Creek Ct