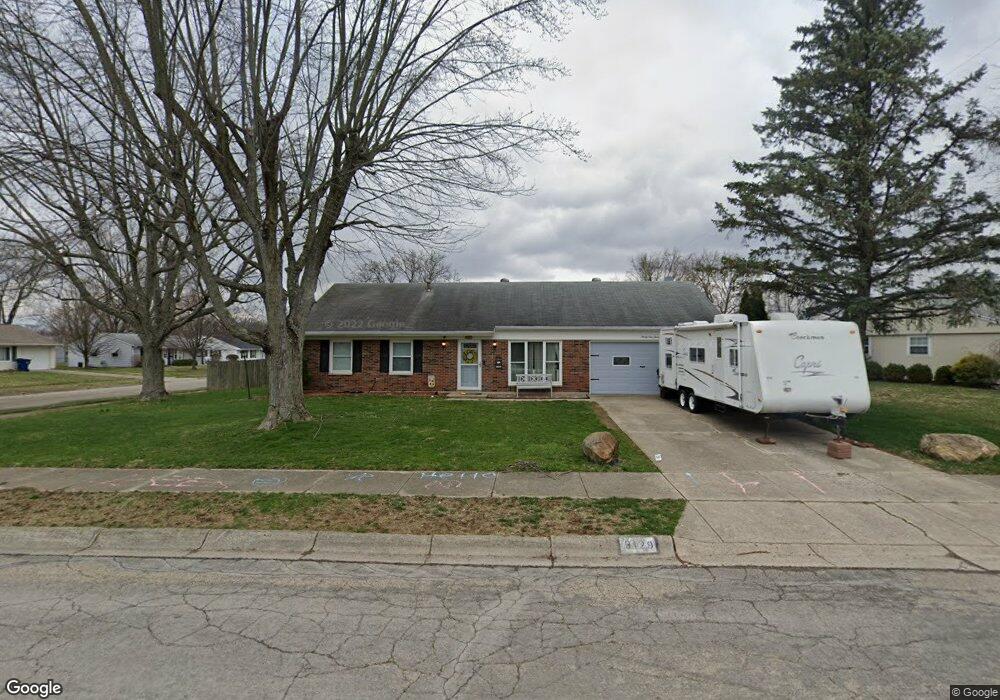
3129 Bristol Dr Springfield, OH 45503
Estimated Value: $181,000 - $205,000
3
Beds
2
Baths
1,073
Sq Ft
$181/Sq Ft
Est. Value
About This Home
This home is located at 3129 Bristol Dr, Springfield, OH 45503 and is currently estimated at $193,970, approximately $180 per square foot. 3129 Bristol Dr is a home located in Clark County with nearby schools including Kenton Elementary School, Roosevelt Middle School, and Springfield High School.
Ownership History
Date
Name
Owned For
Owner Type
Purchase Details
Closed on
Feb 2, 2021
Sold by
Lauffenburger Linda M
Bought by
Lauffenburger Kate
Current Estimated Value
Purchase Details
Closed on
Jun 28, 2010
Sold by
Perry William A
Bought by
Lauffenburger Linda M
Purchase Details
Closed on
Jan 27, 2010
Sold by
Beegle Larry D
Bought by
Perry William A
Purchase Details
Closed on
Aug 31, 1999
Sold by
Harlow Elizabeth A
Bought by
Beegle Larry D and Beegle Constance M
Home Financials for this Owner
Home Financials are based on the most recent Mortgage that was taken out on this home.
Original Mortgage
$91,800
Interest Rate
7.77%
Mortgage Type
VA
Purchase Details
Closed on
Nov 19, 1998
Sold by
Grisco Mary V
Bought by
Harlow Elizabeth A
Home Financials for this Owner
Home Financials are based on the most recent Mortgage that was taken out on this home.
Original Mortgage
$84,085
Interest Rate
6.59%
Mortgage Type
FHA
Create a Home Valuation Report for This Property
The Home Valuation Report is an in-depth analysis detailing your home's value as well as a comparison with similar homes in the area
Home Values in the Area
Average Home Value in this Area
Purchase History
| Date | Buyer | Sale Price | Title Company |
|---|---|---|---|
| Lauffenburger Kate | -- | None Available | |
| Lauffenburger Linda M | $84,000 | None Available | |
| Perry William A | $67,861 | None Available | |
| Beegle Larry D | $90,000 | -- | |
| Harlow Elizabeth A | $84,900 | -- |
Source: Public Records
Mortgage History
| Date | Status | Borrower | Loan Amount |
|---|---|---|---|
| Previous Owner | Beegle Larry D | $91,800 | |
| Previous Owner | Harlow Elizabeth A | $84,085 |
Source: Public Records
Tax History
| Year | Tax Paid | Tax Assessment Tax Assessment Total Assessment is a certain percentage of the fair market value that is determined by local assessors to be the total taxable value of land and additions on the property. | Land | Improvement |
|---|---|---|---|---|
| 2025 | $2,211 | $54,970 | $10,890 | $44,080 |
| 2024 | $559 | $44,680 | $10,350 | $34,330 |
| 2023 | $2,288 | $44,680 | $10,350 | $34,330 |
| 2022 | $0 | $44,680 | $10,350 | $34,330 |
| 2021 | $1,899 | $34,560 | $7,780 | $26,780 |
| 2020 | $1,903 | $34,560 | $7,780 | $26,780 |
| 2019 | $1,908 | $34,560 | $7,780 | $26,780 |
| 2018 | $2,000 | $34,780 | $8,250 | $26,530 |
| 2017 | $1,999 | $31,367 | $8,246 | $23,121 |
| 2016 | $2,002 | $31,367 | $8,246 | $23,121 |
| 2015 | $919 | $30,902 | $7,781 | $23,121 |
| 2014 | $1,831 | $30,902 | $7,781 | $23,121 |
| 2013 | $906 | $30,902 | $7,781 | $23,121 |
Source: Public Records
Map
Nearby Homes
- 1948 Falmouth Ave
- 3300 Revels St
- 3214 Revels St
- 2022 Westboro Ave
- 1924 Marinette Dr
- 2043 Providence Ave
- 1516 Hyannis Dr
- 1811 Devon Dr
- 1032 Armsgate Rd
- 1040 Carson Ln
- 2529 Marinette Dr
- 1139 Bradford Dr
- 3126 Lakeview Ct Unit 3126
- 1149 Foxboro Rd
- 1136 Foxboro Rd Unit 202
- 3124 El Camino Dr
- 2861 Ashlar Dr
- 2400 Thor Dr
- 1507 Kingsgate Rd
- 3631 Kingsgate Ln
- 3137 Bristol Dr
- 3223 Bristol Dr
- 3215 Nantucket St
- 3207 Nantucket St
- 3120 Bristol Dr
- 3230 Nantucket St
- 3223 Nantucket St
- 3128 Bristol Dr
- 3201 Nantucket St
- 3229 Bristol Dr
- 3229 Nantucket St
- 3238 Nantucket St
- 3153 Nantucket St
- 3136 Bristol Dr
- 3237 Bristol Dr
- 3146 Nantucket St
- 3216 Haverhill St
- 3208 Haverhill St
- 3237 Nantucket St
- 3224 Haverhill St
Your Personal Tour Guide
Ask me questions while you tour the home.