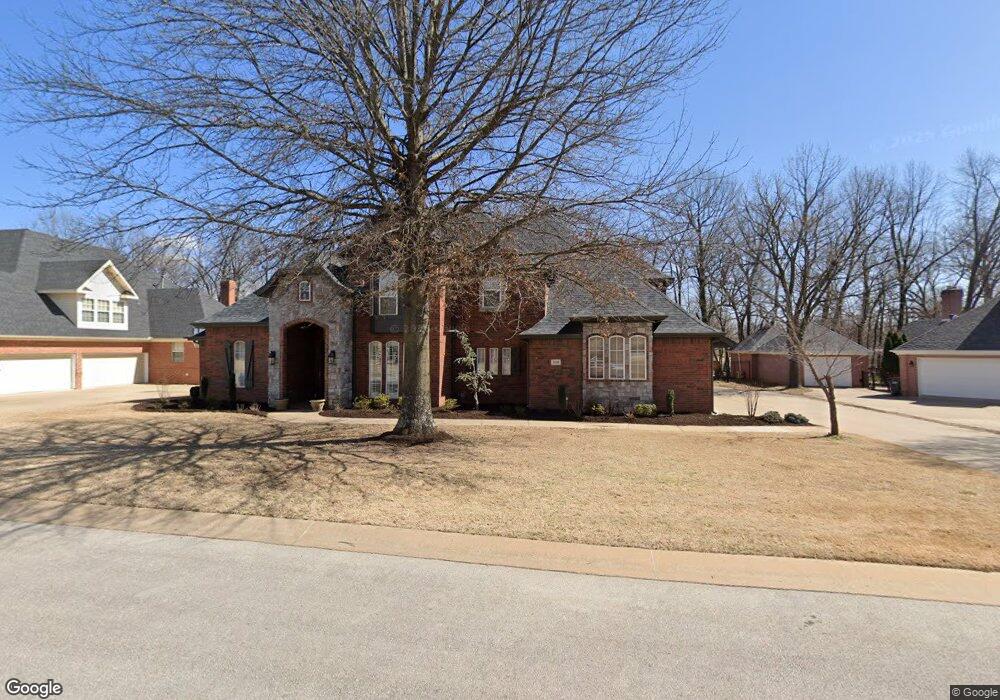
3129 Tanglewood Dr Springdale, AR 72764
Estimated Value: $754,000 - $893,000
4
Beds
4
Baths
3,700
Sq Ft
$221/Sq Ft
Est. Value
About This Home
This home is located at 3129 Tanglewood Dr, Springdale, AR 72764 and is currently estimated at $817,641, approximately $220 per square foot. 3129 Tanglewood Dr is a home located in Benton County with nearby schools including Hunt Elementary School, Central Junior High School, and Hellstern Middle School.
Ownership History
Date
Name
Owned For
Owner Type
Purchase Details
Closed on
Dec 17, 2021
Sold by
Hodge Dewain W and Hodge Shannon C
Bought by
Hodge Dewain William and Hodge Shannon Cherry
Current Estimated Value
Purchase Details
Closed on
Apr 28, 2006
Sold by
Trainor John and Trainor Kerri K
Bought by
Hodge Dewain W and Hodge Shannon C
Home Financials for this Owner
Home Financials are based on the most recent Mortgage that was taken out on this home.
Original Mortgage
$441,000
Outstanding Balance
$248,128
Interest Rate
6%
Mortgage Type
Purchase Money Mortgage
Estimated Equity
$569,513
Purchase Details
Closed on
Jun 18, 2002
Bought by
Trainor
Purchase Details
Closed on
Jun 11, 2002
Bought by
Richland
Purchase Details
Closed on
Jan 15, 2002
Bought by
Richland
Create a Home Valuation Report for This Property
The Home Valuation Report is an in-depth analysis detailing your home's value as well as a comparison with similar homes in the area
Home Values in the Area
Average Home Value in this Area
Purchase History
| Date | Buyer | Sale Price | Title Company |
|---|---|---|---|
| Hodge Dewain William | -- | None Available | |
| Hodge Dewain W | $490,000 | Elite Title Company Inc | |
| Trainor | $375,000 | -- | |
| Richland | -- | -- | |
| Richland | -- | -- |
Source: Public Records
Mortgage History
| Date | Status | Borrower | Loan Amount |
|---|---|---|---|
| Open | Hodge Dewain W | $441,000 |
Source: Public Records
Tax History Compared to Growth
Tax History
| Year | Tax Paid | Tax Assessment Tax Assessment Total Assessment is a certain percentage of the fair market value that is determined by local assessors to be the total taxable value of land and additions on the property. | Land | Improvement |
|---|---|---|---|---|
| 2025 | $5,110 | $132,571 | $24,000 | $108,571 |
| 2024 | $4,989 | $132,571 | $24,000 | $108,571 |
| 2023 | $4,752 | $89,150 | $15,200 | $73,950 |
| 2022 | $4,386 | $89,150 | $15,200 | $73,950 |
| 2021 | $4,367 | $89,150 | $15,200 | $73,950 |
| 2020 | $4,171 | $85,300 | $12,800 | $72,500 |
| 2019 | $4,171 | $85,300 | $12,800 | $72,500 |
| 2018 | $4,196 | $85,300 | $12,800 | $72,500 |
| 2017 | $4,196 | $85,300 | $12,800 | $72,500 |
| 2016 | $4,196 | $85,300 | $12,800 | $72,500 |
| 2015 | $4,934 | $92,570 | $10,000 | $82,570 |
| 2014 | $4,584 | $92,570 | $10,000 | $82,570 |
Source: Public Records
Map
Nearby Homes
- 3098 Sagely Ln
- 1483 Leesburg Ave
- 3800 Tanglewood Dr
- 7.25 AC Thompson
- 4210 Essex Cove
- 3453 Knox Loop
- 1719 Wensworth Ave
- 3038 Cherry Knoll Cir
- Justin Plan at Nature Walk
- Cali Plan at Nature Walk
- Garfield Plan at Nature Walk
- Lakeway Plan at Nature Walk
- 2098 Plan at Nature Walk
- Naples Plan at Nature Walk
- 1550 Ridgeview Dr
- 1566 Ridgeview Dr
- 1308 W Stultz Rd
- 3450 Pasofino Loop
- 1462 Ridgeview Dr
- 1719 Ridgeview Dr
- 3157 Tanglewood Dr
- 3089 Tanglewood Dr
- 0 Tanglewood Dr
- 3134 Tanglewood Dr
- 3185 Tanglewood Dr
- 3053 Tanglewood Dr
- 3092 Tanglewood Dr
- 3172 Tanglewood Dr
- Lot 14 Tanglewood Dr
- 3219 Tanglewood Dr
- 3036 Tanglewood Dr
- 3129 Sagely Ln
- 3155 Sagely Ln
- 3067 Sagely Ln
- 3233 Tanglewood Dr
- 3191 Sagely Ln
- 3010 Tanglewood Dr
- 3031 Sagely Ln
- 3256 Tanglewood Dr
- 0 Sagely Ln Unit 657334