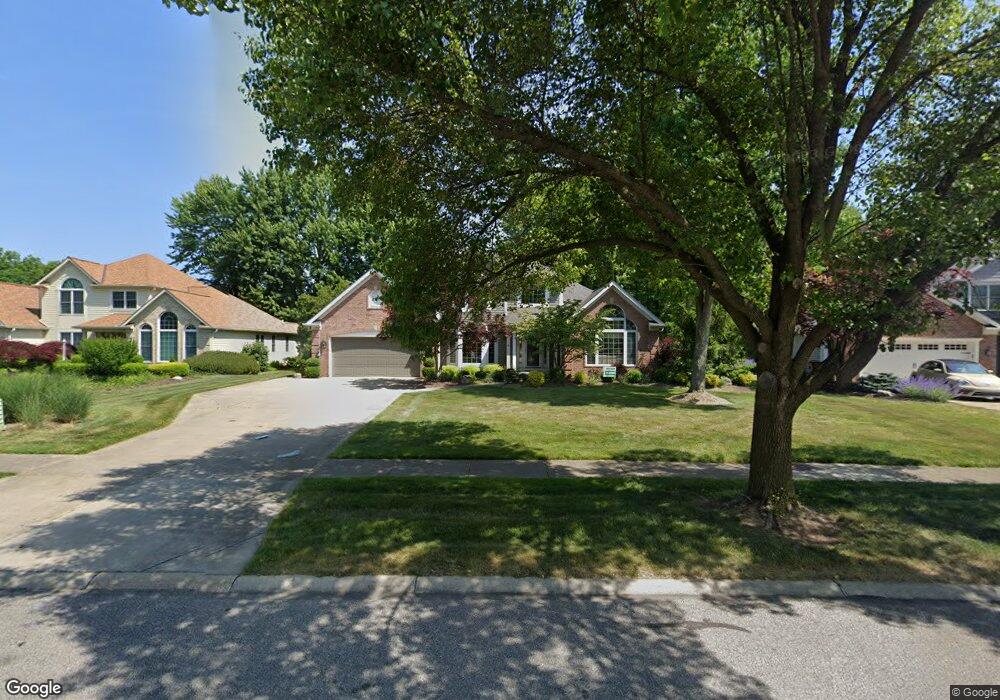
31296 Bishops Gate Cir Westlake, OH 44145
Estimated Value: $564,000 - $646,000
4
Beds
3
Baths
2,658
Sq Ft
$225/Sq Ft
Est. Value
About This Home
This home is located at 31296 Bishops Gate Cir, Westlake, OH 44145 and is currently estimated at $598,651, approximately $225 per square foot. 31296 Bishops Gate Cir is a home located in Cuyahoga County with nearby schools including Dover Intermediate School, Lee Burneson Middle School, and Westlake High School.
Ownership History
Date
Name
Owned For
Owner Type
Purchase Details
Closed on
Nov 10, 2021
Sold by
Butch Janet A
Bought by
Fuerst Thomas C and Weaver Joan Anita
Current Estimated Value
Home Financials for this Owner
Home Financials are based on the most recent Mortgage that was taken out on this home.
Original Mortgage
$395,200
Outstanding Balance
$362,133
Interest Rate
2.99%
Mortgage Type
Purchase Money Mortgage
Estimated Equity
$236,518
Purchase Details
Closed on
Oct 1, 1999
Sold by
Ridill Dale C and Ridill Lois J
Bought by
Butch Niel R and Butch Janet A
Home Financials for this Owner
Home Financials are based on the most recent Mortgage that was taken out on this home.
Original Mortgage
$268,000
Interest Rate
7.9%
Purchase Details
Closed on
Oct 12, 1990
Bought by
Ridill Dale C
Purchase Details
Closed on
Jan 1, 1989
Bought by
Fairland Bldrs Inc
Create a Home Valuation Report for This Property
The Home Valuation Report is an in-depth analysis detailing your home's value as well as a comparison with similar homes in the area
Home Values in the Area
Average Home Value in this Area
Purchase History
| Date | Buyer | Sale Price | Title Company |
|---|---|---|---|
| Fuerst Thomas C | $465,000 | Chicago Title Insurance C | |
| Butch Niel R | $335,000 | Resource Title Agency Inc | |
| Ridill Dale C | $237,500 | -- | |
| Fairland Bldrs Inc | -- | -- |
Source: Public Records
Mortgage History
| Date | Status | Borrower | Loan Amount |
|---|---|---|---|
| Open | Fuerst Thomas C | $395,200 | |
| Previous Owner | Butch Niel R | $268,000 |
Source: Public Records
Tax History Compared to Growth
Tax History
| Year | Tax Paid | Tax Assessment Tax Assessment Total Assessment is a certain percentage of the fair market value that is determined by local assessors to be the total taxable value of land and additions on the property. | Land | Improvement |
|---|---|---|---|---|
| 2024 | $8,577 | $181,055 | $35,665 | $145,390 |
| 2023 | $7,640 | $137,870 | $36,540 | $101,330 |
| 2022 | $7,517 | $137,870 | $36,540 | $101,330 |
| 2021 | $7,049 | $137,870 | $36,540 | $101,330 |
| 2020 | $7,447 | $133,880 | $35,490 | $98,390 |
| 2019 | $7,221 | $382,500 | $101,400 | $281,100 |
| 2018 | $6,982 | $133,880 | $35,490 | $98,390 |
| 2017 | $6,784 | $118,830 | $27,370 | $91,460 |
| 2016 | $6,748 | $118,830 | $27,370 | $91,460 |
| 2015 | $6,078 | $118,830 | $27,370 | $91,460 |
| 2014 | $6,078 | $106,090 | $24,430 | $81,660 |
Source: Public Records
Map
Nearby Homes
- S/L 5 Bradley Rd
- S/L 4 Bradley Rd
- 3133 Waterfall Way
- S/L Z Carlton Ave
- Scottsdale Plan at The Reserve at Mass Estates - Estate Series
- Rockport Plan at The Reserve at Mass Estates - Estate Series
- Rivendale Plan at The Reserve at Mass Estates - Estate Series
- Mayfield Plan at The Reserve at Mass Estates - Estate Series
- Kensington Plan at The Reserve at Mass Estates - Estate Series
- Aspen Plan at The Reserve at Mass Estates - Estate Series
- 3115 Bradley Rd
- 3402 Mass Dr
- 4814 Mills Pointe Way
- Lyon Plan at Carlton Estates
- Bourges Plan at Carlton Estates
- Deer Valley Plan at Carlton Estates
- Woodside Plan at Carlton Estates
- Willwood Plan at Carlton Estates
- Allison II Plan at Carlton Estates
- The Mahogony III Plan at Fieldstone Landings
- 31328 Bishops Gate Cir
- 31268 Bishops Gate Cir
- 3667 Parsons Pond Cir
- 31230 Hilliard Blvd
- 31218 Hilliard Blvd
- 3659 Parsons Pond Cir
- 31333 Bishops Gate Cir
- 3680 Parsons Pond Cir
- 31206 Hilliard Blvd
- 31365 Bishops Gate Cir
- 3672 Parsons Pond Cir
- 31258 Hilliard Blvd
- 3651 Parsons Pond Cir
- 3664 Parsons Pond Cir
- 31290 Hilliard Blvd
- 31397 Bishops Gate Cir
- 31200 Hilliard Blvd
- 3656 Parsons Pond Cir
- 31269 E Churchill Ln
- 31239 Hilliard Blvd