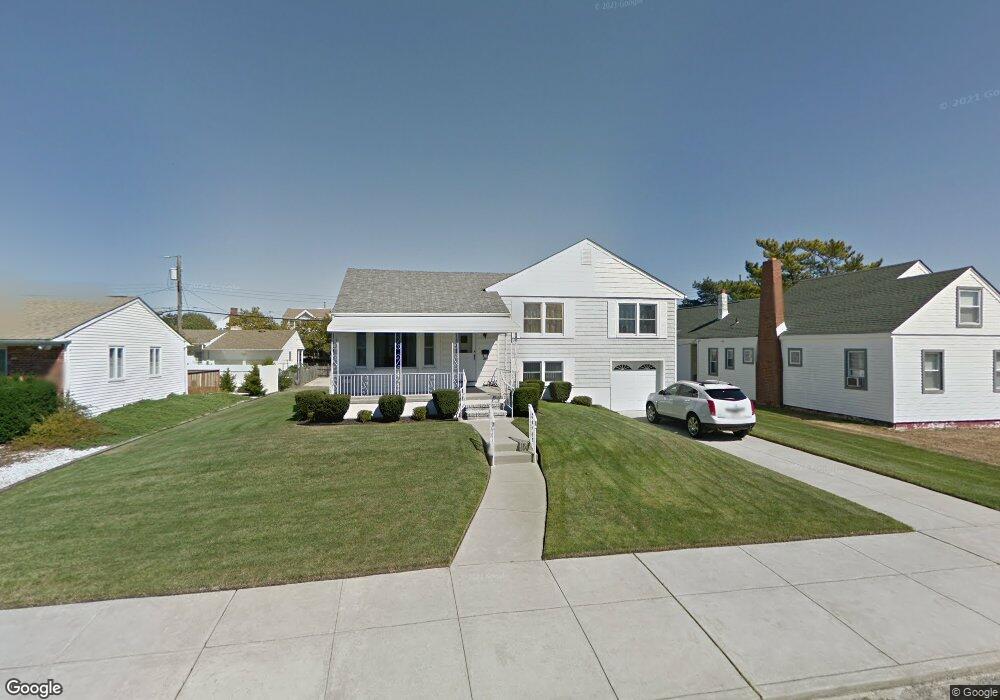
313 30th St S Brigantine, NJ 08203
Estimated Value: $911,000 - $1,264,000
--
Bed
--
Bath
1,770
Sq Ft
$617/Sq Ft
Est. Value
About This Home
This home is located at 313 30th St S, Brigantine, NJ 08203 and is currently estimated at $1,092,930, approximately $617 per square foot. 313 30th St S is a home located in Atlantic County with nearby schools including Brigantine Elementary School, Brigantine Community School, and New Hope Christian Academy/Robinson Small Learning Center.
Ownership History
Date
Name
Owned For
Owner Type
Purchase Details
Closed on
Jun 27, 2022
Sold by
Cawley Joseph P
Bought by
Cawley Joseph P and Cawley Barbara
Current Estimated Value
Home Financials for this Owner
Home Financials are based on the most recent Mortgage that was taken out on this home.
Original Mortgage
$960,000
Outstanding Balance
$943,741
Interest Rate
1.9%
Mortgage Type
FHA
Estimated Equity
$149,189
Purchase Details
Closed on
Sep 30, 2008
Sold by
Cawley Joseph P
Bought by
Cawley Joseph P
Create a Home Valuation Report for This Property
The Home Valuation Report is an in-depth analysis detailing your home's value as well as a comparison with similar homes in the area
Home Values in the Area
Average Home Value in this Area
Purchase History
| Date | Buyer | Sale Price | Title Company |
|---|---|---|---|
| Cawley Joseph P | -- | None Listed On Document | |
| Cawley Joseph P | -- | None Available |
Source: Public Records
Mortgage History
| Date | Status | Borrower | Loan Amount |
|---|---|---|---|
| Open | Cawley Joseph P | $960,000 | |
| Closed | Cawley Joseph P | $960,000 |
Source: Public Records
Tax History Compared to Growth
Tax History
| Year | Tax Paid | Tax Assessment Tax Assessment Total Assessment is a certain percentage of the fair market value that is determined by local assessors to be the total taxable value of land and additions on the property. | Land | Improvement |
|---|---|---|---|---|
| 2025 | $10,656 | $566,800 | $443,000 | $123,800 |
| 2024 | $10,656 | $566,800 | $443,000 | $123,800 |
| 2023 | $9,845 | $566,800 | $443,000 | $123,800 |
| 2022 | $9,845 | $566,800 | $443,000 | $123,800 |
| 2021 | $9,670 | $566,800 | $443,000 | $123,800 |
| 2020 | $9,568 | $566,800 | $443,000 | $123,800 |
| 2019 | $9,653 | $566,800 | $443,000 | $123,800 |
| 2018 | $9,845 | $566,800 | $443,000 | $123,800 |
| 2017 | $10,004 | $566,800 | $443,000 | $123,800 |
| 2016 | $9,998 | $566,800 | $443,000 | $123,800 |
| 2015 | $10,049 | $566,800 | $443,000 | $123,800 |
| 2014 | $9,675 | $566,800 | $443,000 | $123,800 |
Source: Public Records
Map
Nearby Homes
- 405 30th St S
- 312 31st St S
- 2502 Ocean Ave
- 3300 W Brigantine Ave Unit 9
- 2905 Revere Blvd
- 102 28th St S
- 3500 Ocean Ave Unit 6
- 327 36th St S Unit B
- 323 36th St S
- 3007 Bayshore Ave Unit 4
- 106 24th St S
- 201 23rd St S
- 326 37th St S Unit A (1st Floor, Right
- 3512 Bayshore Ave
- 251 38th St S
- 301 20th St S
- 1904 W Brigantine Ave
- 155 39th St S
- 314 41st St S
- 158 39th St S Unit 68