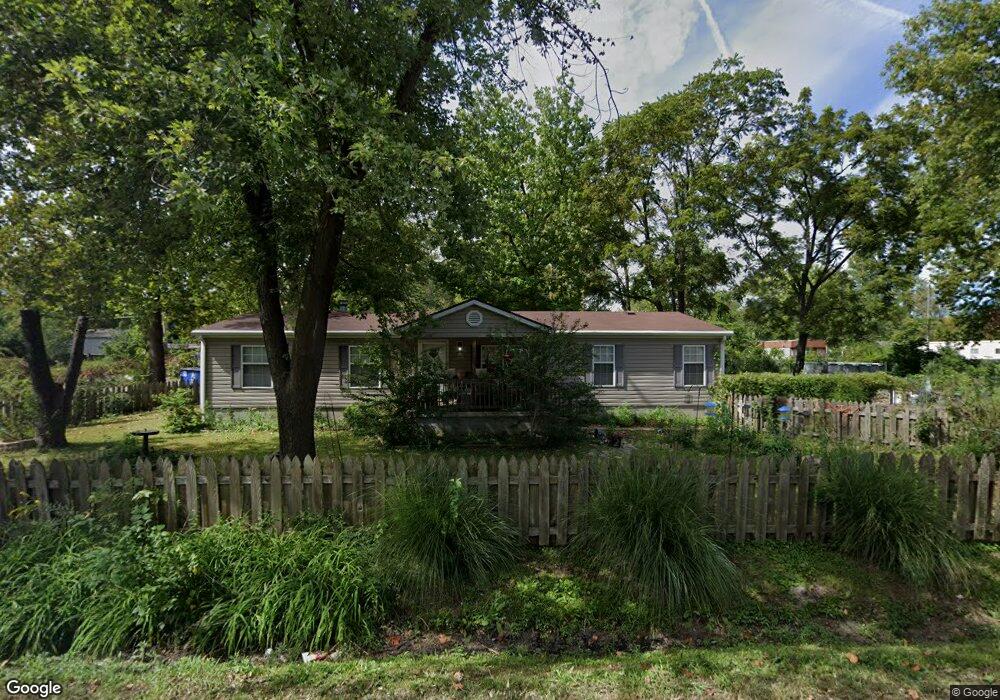
313 Art St Collinsville, IL 62234
Estimated Value: $138,000 - $170,000
--
Bed
--
Bath
--
Sq Ft
0.36
Acres
About This Home
This home is located at 313 Art St, Collinsville, IL 62234 and is currently estimated at $150,333. 313 Art St is a home located in St. Clair County with nearby schools including Kreitner Elementary School, Dorris Intermediate School, and Collinsville Middle School.
Ownership History
Date
Name
Owned For
Owner Type
Purchase Details
Closed on
Nov 12, 2015
Sold by
Vanderbilt Mortgage & Finance Inc
Bought by
Mager Robert A
Current Estimated Value
Home Financials for this Owner
Home Financials are based on the most recent Mortgage that was taken out on this home.
Original Mortgage
$35,224
Outstanding Balance
$27,696
Interest Rate
3.78%
Mortgage Type
Seller Take Back
Estimated Equity
$122,637
Purchase Details
Closed on
Jul 24, 2015
Sold by
Dunn Jennifer N and Dunn Dennis
Bought by
Vanderbilt Mortgage & Finance Inc
Purchase Details
Closed on
Jul 27, 2014
Sold by
Dunn Jennifer N and Dun Dennis
Bought by
Vanderbilt Mortgage & Finance Inc
Purchase Details
Closed on
Sep 14, 2009
Sold by
Dunn Dennis and Dunn Jennifer
Bought by
Dunn Jennifer
Home Financials for this Owner
Home Financials are based on the most recent Mortgage that was taken out on this home.
Original Mortgage
$83,136
Interest Rate
5.32%
Mortgage Type
New Conventional
Create a Home Valuation Report for This Property
The Home Valuation Report is an in-depth analysis detailing your home's value as well as a comparison with similar homes in the area
Home Values in the Area
Average Home Value in this Area
Purchase History
| Date | Buyer | Sale Price | Title Company |
|---|---|---|---|
| Mager Robert A | $30,000 | Attorney | |
| Vanderbilt Mortgage & Finance Inc | -- | Attorney | |
| Vanderbilt Mortgage & Finance Inc | -- | Attorney | |
| Dunn Jennifer | -- | Benedick Title Ins |
Source: Public Records
Mortgage History
| Date | Status | Borrower | Loan Amount |
|---|---|---|---|
| Open | Mager Robert A | $35,224 | |
| Previous Owner | Dunn Jennifer | $83,136 |
Source: Public Records
Tax History Compared to Growth
Tax History
| Year | Tax Paid | Tax Assessment Tax Assessment Total Assessment is a certain percentage of the fair market value that is determined by local assessors to be the total taxable value of land and additions on the property. | Land | Improvement |
|---|---|---|---|---|
| 2024 | $141 | $1,845 | $1,845 | $0 |
| 2023 | $140 | $1,798 | $1,798 | $0 |
| 2022 | $128 | $1,652 | $1,652 | $0 |
| 2021 | $130 | $1,646 | $1,646 | $0 |
| 2020 | $128 | $1,654 | $1,654 | $0 |
| 2019 | $135 | $1,654 | $1,654 | $0 |
| 2018 | $137 | $1,679 | $1,679 | $0 |
| 2017 | $129 | $1,547 | $1,547 | $0 |
| 2016 | $130 | $1,557 | $1,557 | $0 |
| 2014 | $126 | $1,557 | $1,557 | $0 |
| 2013 | -- | $3,192 | $3,158 | $34 |
Source: Public Records
Map
Nearby Homes
- 1735 Cherokee St
- 504 S 5th St
- 24 W Reynolds St
- 408 Hillside Dr
- 602 S 5th St
- 397 Nicole Dr
- 298 Nicole Dr
- 286 Nicole Dr
- 806 Erika Leigh Ct
- 282 Nicole Dr
- 270 Nicole Dr
- 101 Osage Dr
- 312 E Ofallon Dr
- 717 Greenwood Place
- 625 Greenwood Place
- 712 Hill Rd
- 45 Bellevue Dr
- 347 Brookside Dr
- 7 Hadfield Ln
- 13 Hillwood Dr