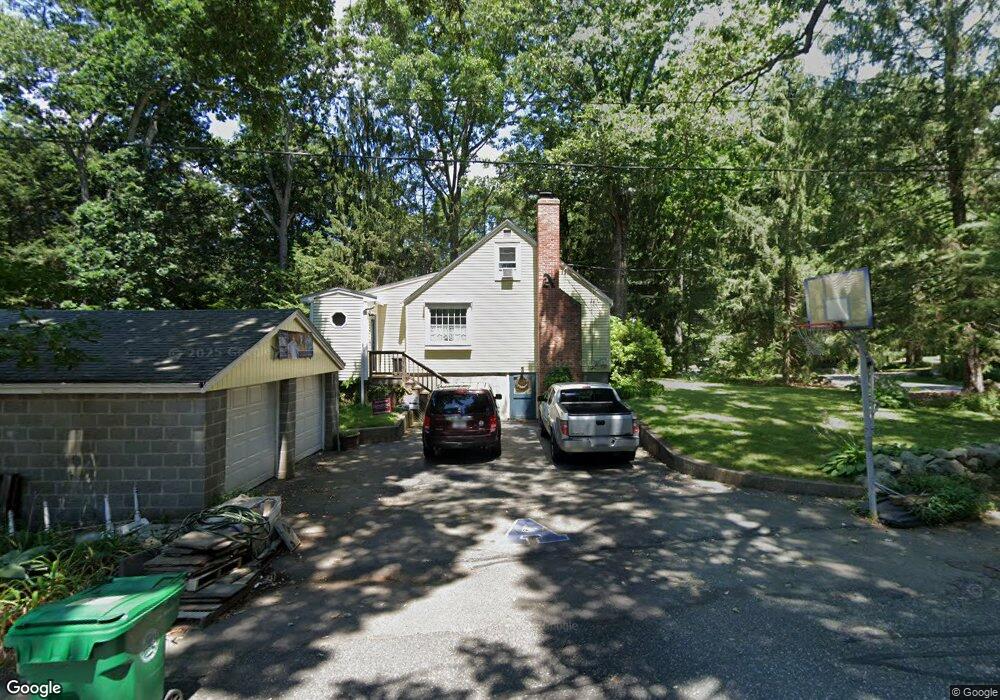
313 Cedar St Ashland, MA 01721
Estimated Value: $574,000 - $726,000
4
Beds
1
Bath
1,152
Sq Ft
$556/Sq Ft
Est. Value
About This Home
This home is located at 313 Cedar St, Ashland, MA 01721 and is currently estimated at $640,744, approximately $556 per square foot. 313 Cedar St is a home located in Middlesex County with nearby schools including William Pittaway Elementary School, Henry E. Warren Elementary School, and David Mindess Elementary School.
Ownership History
Date
Name
Owned For
Owner Type
Purchase Details
Closed on
Mar 19, 1998
Sold by
Aalto Tauno O and Aalto Sally L
Bought by
Arseneault Andrew J and Arseneault Courtney
Current Estimated Value
Create a Home Valuation Report for This Property
The Home Valuation Report is an in-depth analysis detailing your home's value as well as a comparison with similar homes in the area
Home Values in the Area
Average Home Value in this Area
Purchase History
| Date | Buyer | Sale Price | Title Company |
|---|---|---|---|
| Arseneault Andrew J | $174,000 | -- |
Source: Public Records
Mortgage History
| Date | Status | Borrower | Loan Amount |
|---|---|---|---|
| Open | Arseneault Andrew J | $142,000 | |
| Closed | Arseneault Andrew J | $147,200 |
Source: Public Records
Tax History
| Year | Tax Paid | Tax Assessment Tax Assessment Total Assessment is a certain percentage of the fair market value that is determined by local assessors to be the total taxable value of land and additions on the property. | Land | Improvement |
|---|---|---|---|---|
| 2025 | $6,929 | $542,600 | $245,700 | $296,900 |
| 2024 | $6,844 | $516,900 | $245,700 | $271,200 |
| 2023 | $6,309 | $458,200 | $234,300 | $223,900 |
| 2022 | $6,400 | $403,000 | $212,500 | $190,500 |
| 2021 | $6,001 | $376,700 | $212,500 | $164,200 |
| 2020 | $5,808 | $359,400 | $212,500 | $146,900 |
| 2019 | $5,648 | $346,900 | $212,500 | $134,400 |
| 2018 | $5,490 | $330,500 | $209,600 | $120,900 |
| 2017 | $5,185 | $310,500 | $205,700 | $104,800 |
| 2016 | $4,988 | $293,400 | $200,600 | $92,800 |
| 2015 | $4,725 | $273,100 | $187,700 | $85,400 |
| 2014 | $4,638 | $266,700 | $168,200 | $98,500 |
Source: Public Records
Map
Nearby Homes
- 207 Eliot St
- 9 Mountain Gate Rd
- 72 Fruit St
- 74 Meeting House Path
- 102 Captain Eames Cir
- 73 Trailside Way
- 276 Trailside Way Unit 276
- 2 Arrowhead Cir Unit 2
- 306 Trailside Way
- 45 Half Crown Cir
- 196 Algonquin Trail Unit 196
- 18 Sherborne Cir
- 140 Algonquin Trail
- 73 Half Crown Cir
- 363 Eliot St
- 37 James Rd
- 62 Ashland St
- 4 John Hancock Dr Unit 4
- 437 America Blvd Unit 437
- 59 Brooksmont Dr Unit 59
Your Personal Tour Guide
Ask me questions while you tour the home.