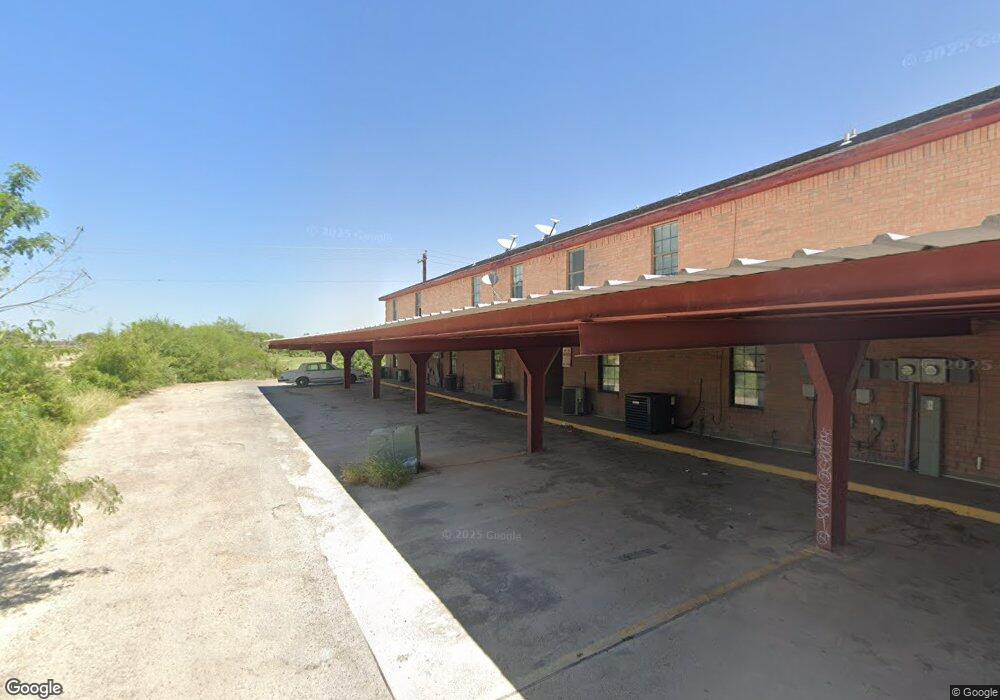
313 Chestnut Dr Edinburg, TX 78541
Estimated Value: $772,000 - $1,210,000
--
Bed
16
Baths
8,641
Sq Ft
$108/Sq Ft
Est. Value
About This Home
This home is located at 313 Chestnut Dr, Edinburg, TX 78541 and is currently estimated at $933,607, approximately $108 per square foot. 313 Chestnut Dr is a home with nearby schools including De La Vina Elementary School, B L Garza Middle School, and Edinburg North High School.
Ownership History
Date
Name
Owned For
Owner Type
Purchase Details
Closed on
Jul 11, 2025
Sold by
J & M Ramirez Family Enterprises Inc
Bought by
Knox Llc
Current Estimated Value
Purchase Details
Closed on
May 4, 2018
Sold by
Del Rey Estates Lp
Bought by
Rivas Edvin Danilo and Hinojosa Elizeth
Home Financials for this Owner
Home Financials are based on the most recent Mortgage that was taken out on this home.
Original Mortgage
$45,400
Interest Rate
4.44%
Mortgage Type
New Conventional
Purchase Details
Closed on
Jan 9, 2013
Sold by
Enben South Texas Ltd
Bought by
Ramirez Mireya Esther
Home Financials for this Owner
Home Financials are based on the most recent Mortgage that was taken out on this home.
Original Mortgage
$36,400
Interest Rate
3.34%
Mortgage Type
New Conventional
Create a Home Valuation Report for This Property
The Home Valuation Report is an in-depth analysis detailing your home's value as well as a comparison with similar homes in the area
Home Values in the Area
Average Home Value in this Area
Purchase History
| Date | Buyer | Sale Price | Title Company |
|---|---|---|---|
| Knox Llc | -- | Championship Title | |
| Rivas Edvin Danilo | -- | Corporation Service Company | |
| Ramirez Mireya Esther | -- | None Available |
Source: Public Records
Mortgage History
| Date | Status | Borrower | Loan Amount |
|---|---|---|---|
| Previous Owner | Rivas Edvin Danilo | $45,400 | |
| Previous Owner | Ramirez Mireya Esther | $36,400 | |
| Closed | Knox Llc | $0 |
Source: Public Records
Tax History Compared to Growth
Tax History
| Year | Tax Paid | Tax Assessment Tax Assessment Total Assessment is a certain percentage of the fair market value that is determined by local assessors to be the total taxable value of land and additions on the property. | Land | Improvement |
|---|---|---|---|---|
| 2025 | $18,853 | $835,109 | $244,350 | $590,759 |
| 2024 | $18,853 | $785,154 | $153,941 | $631,213 |
| 2023 | $18,838 | $785,154 | $153,941 | $631,213 |
| 2022 | $19,381 | $744,265 | $153,941 | $590,324 |
| 2021 | $14,592 | $538,886 | $157,606 | $381,280 |
| 2020 | $14,363 | $527,890 | $146,610 | $381,280 |
| 2019 | $14,776 | $532,068 | $146,610 | $385,458 |
| 2018 | $14,587 | $523,929 | $146,610 | $377,319 |
| 2017 | $12,916 | $462,269 | $104,256 | $358,013 |
| 2016 | $13,101 | $468,864 | $104,256 | $364,608 |
| 2015 | $13,207 | $468,378 | $104,256 | $364,122 |
Source: Public Records
Map
Nearby Homes
- 2206 Kimberly Ln
- 2512 Salvatierra Ave
- 2106 Kimberly Ln
- 2104 Kimberly Ln
- 305 Laramie Dr Unit D
- 305 Laramie Dr Unit B
- 305 Laramie Dr Unit C
- 305 Laramie Dr Unit A
- 601 La Mancha Dr
- 613 La Mancha Dr
- 2514 Cervantes Ave
- 2520 Cervantes Ave
- 3348 W University Dr
- 0000 Texas 107
- 815 N Cross Ln
- 701 N Alexandrite Ave
- 604 N Onyx Ave
- 709 N Emerald Ave
- 504 N Emerald Ave
- 404 N Alexandrite Ave
- 2403 Kimberly Ln
- 2406 Kimberly Ln
- 2309 Kimberly Ln
- 2402 Kimberly Ln Unit 2
- 2401 Kimberly Ln Unit 3
- 2401 Kimberly Ln
- 2307 Kimberly Ln
- 2306 Kimberly Ln
- 2305 Kimberly Ln Unit 3
- 2305 Kimberly Ln Unit 2
- 2305 Kimberly Ln
- 2304 Kimberly Ln
- 2303 Kimberly Ln
- 2302 Kimberly Ln
- 2503 Salvatierra Ave Unit 33
- 2503 Salvatierra Ave Unit 13
- 2503 Salvatierra Ave Unit 32
- 2503 Salvatierra Ave Unit 29
- 2503 Salvatierra Ave Unit 19
- 2503 Salvatierra Ave Unit 5