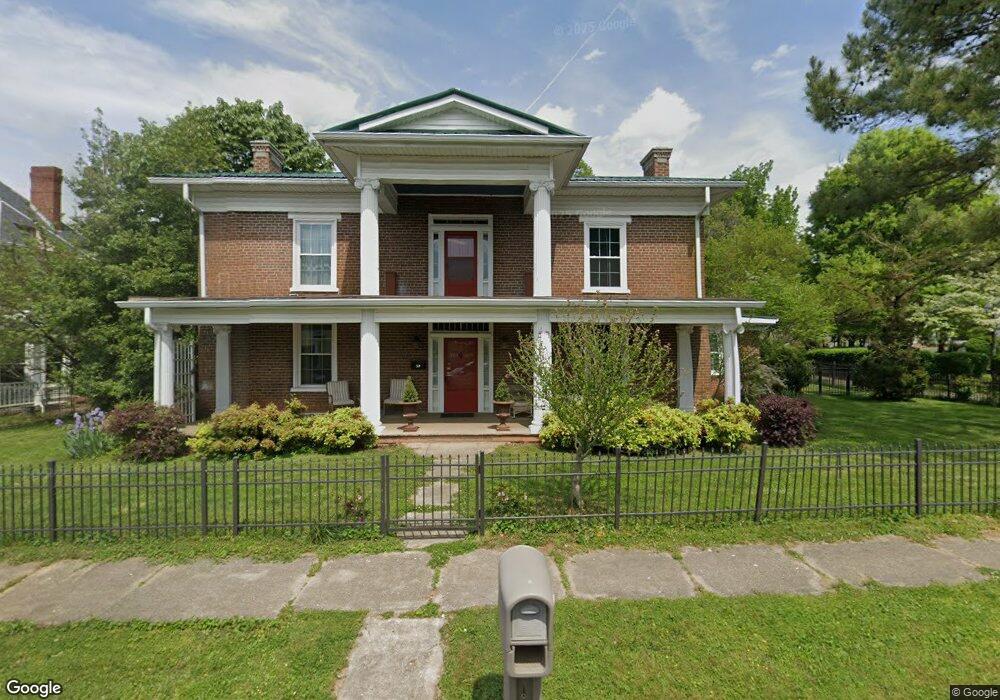
313 E 3rd North St Morristown, TN 37814
Estimated Value: $470,000 - $549,000
5
Beds
3
Baths
3,486
Sq Ft
$145/Sq Ft
Est. Value
About This Home
This home is located at 313 E 3rd North St, Morristown, TN 37814 and is currently estimated at $505,276, approximately $144 per square foot. 313 E 3rd North St is a home located in Hamblen County with nearby schools including Hillcrest Elementary School, Meadowview Middle School, and Morristown East High School.
Ownership History
Date
Name
Owned For
Owner Type
Purchase Details
Closed on
Dec 17, 2020
Sold by
Hance Michael and Hance Misty
Bought by
Edens Mark E and Vantries Amy
Current Estimated Value
Home Financials for this Owner
Home Financials are based on the most recent Mortgage that was taken out on this home.
Original Mortgage
$196,000
Outstanding Balance
$173,693
Interest Rate
2.7%
Mortgage Type
New Conventional
Estimated Equity
$331,583
Purchase Details
Closed on
Dec 7, 2020
Sold by
Hance Michael and Hance Misty
Bought by
Edens Mark E and Vantries Amy
Home Financials for this Owner
Home Financials are based on the most recent Mortgage that was taken out on this home.
Original Mortgage
$196,000
Outstanding Balance
$173,693
Interest Rate
2.7%
Mortgage Type
New Conventional
Estimated Equity
$331,583
Purchase Details
Closed on
Apr 1, 2002
Sold by
Bruce Campbell
Bought by
Hance Michael
Home Financials for this Owner
Home Financials are based on the most recent Mortgage that was taken out on this home.
Original Mortgage
$138,000
Interest Rate
6.8%
Purchase Details
Closed on
May 5, 1962
Bought by
Campbell Bruce J and Campbell Dorothy A
Create a Home Valuation Report for This Property
The Home Valuation Report is an in-depth analysis detailing your home's value as well as a comparison with similar homes in the area
Home Values in the Area
Average Home Value in this Area
Purchase History
| Date | Buyer | Sale Price | Title Company |
|---|---|---|---|
| Edens Mark E | $245,000 | None Listed On Document | |
| Edens Mark E | $245,000 | None Available | |
| Hance Michael | $172,500 | -- | |
| Campbell Bruce J | -- | -- |
Source: Public Records
Mortgage History
| Date | Status | Borrower | Loan Amount |
|---|---|---|---|
| Open | Edens Mark E | $196,000 | |
| Closed | Edens Mark E | $196,000 | |
| Previous Owner | Campbell Bruce J | $138,000 |
Source: Public Records
Tax History
| Year | Tax Paid | Tax Assessment Tax Assessment Total Assessment is a certain percentage of the fair market value that is determined by local assessors to be the total taxable value of land and additions on the property. | Land | Improvement |
|---|---|---|---|---|
| 2025 | $1,776 | $135,600 | $10,425 | $125,175 |
| 2024 | $1,377 | $78,250 | $9,550 | $68,700 |
| 2023 | $1,377 | $78,250 | $0 | $0 |
| 2022 | $2,473 | $78,250 | $9,550 | $68,700 |
| 2021 | $2,473 | $78,250 | $9,550 | $68,700 |
| 2020 | $2,469 | $78,250 | $9,550 | $68,700 |
| 2019 | $2,325 | $68,375 | $11,225 | $57,150 |
| 2018 | $2,154 | $68,375 | $11,225 | $57,150 |
| 2017 | $2,120 | $68,375 | $11,225 | $57,150 |
| 2016 | $2,024 | $68,375 | $11,225 | $57,150 |
| 2015 | $1,883 | $68,375 | $11,225 | $57,150 |
| 2014 | -- | $68,375 | $11,225 | $57,150 |
| 2013 | -- | $79,375 | $0 | $0 |
Source: Public Records
Map
Nearby Homes
- 513 E 1st North St
- 600 E 2nd North St
- 324 Anderson St
- 111 E Main St Unit 113A
- 721 E 1st North St
- 721 E 1st St N
- 2078 Edgewater Sound Rd Unit 8
- 2078 Edgewater Sound Rd
- 2359 Stream View Ln
- 637 Carriger St
- 1019 E 4th North St
- TBD W 9th North St
- 523 N Jackson St
- 1036 N Henry St
- 327 Euclid Ave
- 734 Seymour St
- 742 Seymour St
- 544 W 7th North St
- 106 King Ave
- 550 W 7th North St
- 303 Third St N
- 325 E 3rd North St
- 303 E 3rd North St
- 325 E 3rd St N
- 312 E 3rd St N
- 312 E 3rd St N
- 312 E 3rd North St
- 306 E 3rd North St
- 312 E 4th North St
- 300 E 3rd North St
- 324 E 3rd North St
- 324 E 3rd St N
- 320 E 4th North St
- 320 4th St N
- 229 E 3rd North St
- 328 E 4th North St
- 320 E 4th St N
- 415 N Daisy St
- 403 E 3rd North St
- 400 E 4th St N
Your Personal Tour Guide
Ask me questions while you tour the home.