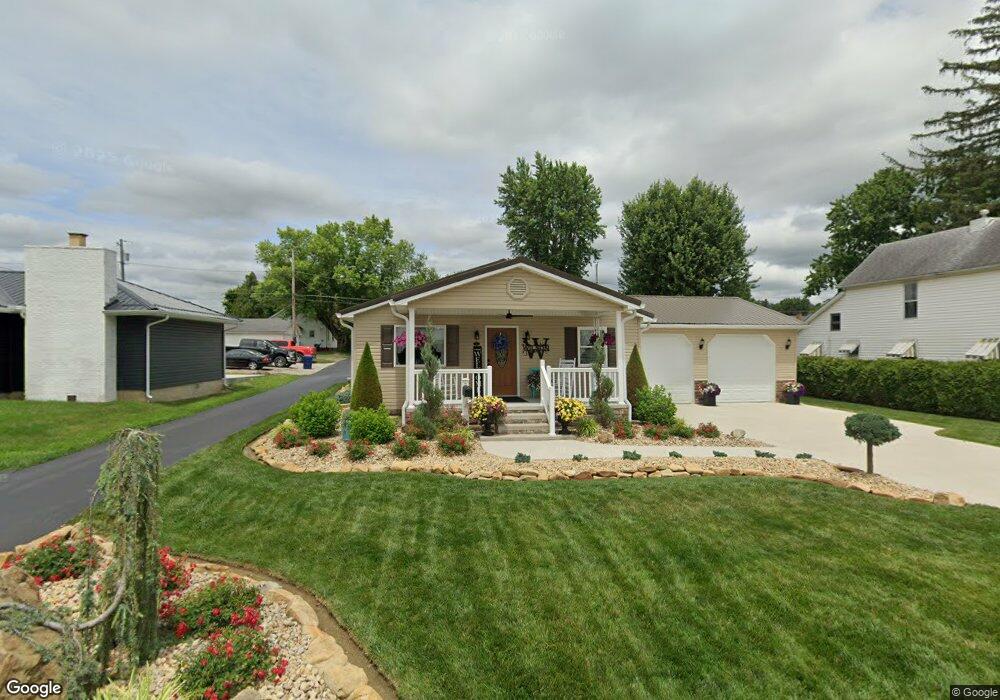
313 E 8th St Wellston, OH 45692
Estimated Value: $141,000 - $189,000
2
Beds
2
Baths
1,200
Sq Ft
$135/Sq Ft
Est. Value
About This Home
This home is located at 313 E 8th St, Wellston, OH 45692 and is currently estimated at $161,710, approximately $134 per square foot. 313 E 8th St is a home located in Jackson County with nearby schools including Bundy Elementary School, Wellston Intermediate School, and Wellston Middle School.
Ownership History
Date
Name
Owned For
Owner Type
Purchase Details
Closed on
Sep 3, 2015
Sold by
Wilson Mary K and Wilson Brent R
Bought by
Wilson Mary K and Wilson Brent R
Current Estimated Value
Purchase Details
Closed on
Apr 29, 2014
Sold by
The First National Bank
Bought by
Henry Mary K
Home Financials for this Owner
Home Financials are based on the most recent Mortgage that was taken out on this home.
Original Mortgage
$48,950
Outstanding Balance
$36,649
Interest Rate
4.33%
Mortgage Type
New Conventional
Estimated Equity
$125,061
Purchase Details
Closed on
Jun 11, 2005
Sold by
Henry Heath Lucas and Henry Melissa Diane
Bought by
Henry Anthony K
Home Financials for this Owner
Home Financials are based on the most recent Mortgage that was taken out on this home.
Original Mortgage
$44,500
Interest Rate
5.91%
Mortgage Type
New Conventional
Purchase Details
Closed on
Apr 8, 1997
Sold by
Tribby Gene C
Bought by
Henry Heath Lucas
Create a Home Valuation Report for This Property
The Home Valuation Report is an in-depth analysis detailing your home's value as well as a comparison with similar homes in the area
Home Values in the Area
Average Home Value in this Area
Purchase History
| Date | Buyer | Sale Price | Title Company |
|---|---|---|---|
| Wilson Mary K | -- | None Available | |
| Henry Mary K | $55,000 | None Available | |
| Henry Anthony K | $50,000 | None Available | |
| Henry Heath Lucas | $40,000 | -- |
Source: Public Records
Mortgage History
| Date | Status | Borrower | Loan Amount |
|---|---|---|---|
| Open | Henry Mary K | $48,950 | |
| Previous Owner | Henry Anthony K | $44,500 |
Source: Public Records
Tax History
| Year | Tax Paid | Tax Assessment Tax Assessment Total Assessment is a certain percentage of the fair market value that is determined by local assessors to be the total taxable value of land and additions on the property. | Land | Improvement |
|---|---|---|---|---|
| 2025 | $1,666 | $45,360 | $3,020 | $42,340 |
| 2024 | $1,600 | $45,360 | $3,020 | $42,340 |
| 2023 | $1,710 | $45,360 | $3,020 | $42,340 |
| 2022 | $1,538 | $32,520 | $2,600 | $29,920 |
| 2021 | $1,298 | $32,520 | $2,600 | $29,920 |
| 2020 | $1,329 | $32,520 | $2,600 | $29,920 |
| 2019 | $1,339 | $31,760 | $2,520 | $29,240 |
| 2018 | $1,300 | $31,760 | $2,520 | $29,240 |
| 2017 | $621 | $31,760 | $2,520 | $29,240 |
| 2016 | $1,209 | $30,650 | $2,800 | $27,850 |
| 2015 | $996 | $25,290 | $2,800 | $22,490 |
| 2013 | $912 | $24,210 | $2,800 | $21,410 |
| 2012 | $1,922 | $24,210 | $2,800 | $21,410 |
Source: Public Records
Map
Nearby Homes
- 303 E 9th St
- 224 E 2nd St
- 122 124 2nd St
- 760 S Rhode Island Ave
- 432 S Michigan Ave
- 1304 S New Jersey Ave
- 0 Ohio 327
- 2417 Glenroy Rd
- 16 E Broadway St
- 1409 S New Jersey Ave
- 115 N Ohio Ave
- 1436 S New York Ave
- 1309 S Maine Ave
- 1440 S New York Ave
- 424 S Missouri Ave
- 203 W 13th St
- 0 Ohio 93
- 101 E D St
- 319 N Park Ave
- 0 D St
Your Personal Tour Guide
Ask me questions while you tour the home.