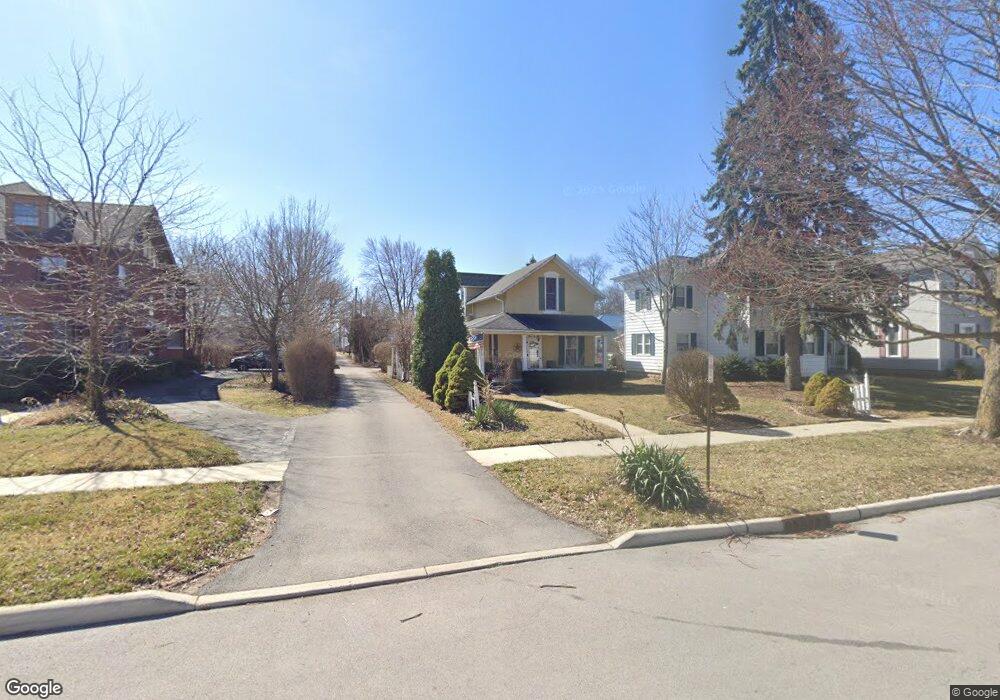
313 E Lima St Findlay, OH 45840
Estimated Value: $182,000 - $197,769
3
Beds
1
Bath
1,515
Sq Ft
$126/Sq Ft
Est. Value
About This Home
This home is located at 313 E Lima St, Findlay, OH 45840 and is currently estimated at $190,942, approximately $126 per square foot. 313 E Lima St is a home located in Hancock County with nearby schools including Lincoln Elementary School, Donnell Middle School, and Findlay High School.
Ownership History
Date
Name
Owned For
Owner Type
Purchase Details
Closed on
Jun 30, 2009
Sold by
Box Frederick J and Box Joyce E
Bought by
Murawski David H and Sweat Heather N
Current Estimated Value
Home Financials for this Owner
Home Financials are based on the most recent Mortgage that was taken out on this home.
Original Mortgage
$76,587
Outstanding Balance
$47,998
Interest Rate
4.86%
Mortgage Type
FHA
Estimated Equity
$142,944
Purchase Details
Closed on
Sep 2, 1992
Bought by
Box Frederick J and Box Joyce E
Purchase Details
Closed on
Feb 2, 1984
Bought by
Morton James N and Morton Constance
Create a Home Valuation Report for This Property
The Home Valuation Report is an in-depth analysis detailing your home's value as well as a comparison with similar homes in the area
Home Values in the Area
Average Home Value in this Area
Purchase History
| Date | Buyer | Sale Price | Title Company |
|---|---|---|---|
| Murawski David H | $78,000 | Mid Am Title | |
| Box Frederick J | $53,000 | -- | |
| Morton James N | $39,700 | -- |
Source: Public Records
Mortgage History
| Date | Status | Borrower | Loan Amount |
|---|---|---|---|
| Open | Murawski David H | $76,587 |
Source: Public Records
Tax History
| Year | Tax Paid | Tax Assessment Tax Assessment Total Assessment is a certain percentage of the fair market value that is determined by local assessors to be the total taxable value of land and additions on the property. | Land | Improvement |
|---|---|---|---|---|
| 2024 | $2,009 | $56,550 | $6,930 | $49,620 |
| 2023 | $2,012 | $56,550 | $6,930 | $49,620 |
| 2022 | $2,005 | $56,550 | $6,930 | $49,620 |
| 2021 | $1,747 | $42,930 | $6,910 | $36,020 |
| 2020 | $1,747 | $42,930 | $6,910 | $36,020 |
| 2019 | $1,712 | $42,930 | $6,910 | $36,020 |
| 2018 | $1,497 | $34,410 | $5,530 | $28,880 |
| 2017 | $748 | $34,410 | $5,530 | $28,880 |
| 2016 | $1,481 | $34,410 | $5,530 | $28,880 |
| 2015 | $986 | $22,550 | $4,740 | $17,810 |
| 2014 | $986 | $22,550 | $4,740 | $17,810 |
| 2012 | $1,064 | $24,100 | $4,740 | $19,360 |
Source: Public Records
Map
Nearby Homes
- 829 Maple Ave
- 865 S Main St
- 216 1st St
- 815 Liberty St
- 412 Lima Ave
- 845 Hurd Ave
- 514 Liberty St
- 623 E Sandusky St
- 423 Elm St
- 123 Glendale Ave
- 860 Hurd Ave
- 206 Greenlawn Ave
- 1113 Hurd Ave
- 527 W Sandusky St
- 324 W Mcpherson Ave
- 407 Washington St
- 731 5th St
- 15591 Canadian Way
- 15586 Canadian Way
- 15615 Canadian Way
- 309 E Lima St
- 309 E Lima St
- 317 E Lima St
- 305 E Lima St
- 301 E Lima St
- 819 Maple Ave
- 325 E Lima St
- 815 Maple Ave
- 807 Maple Ave Unit 807 Maple Ave (U3), Findlay Ohio, 45840
- 818 Washington Ave
- 823 Maple Ave
- 312 E Lima St
- 329 E Lima St
- 814 Washington Ave
- 824 Washington Ave
- 232 E Lima St
- 219 E Lima St
- 812 Maple Ave
- 228 E Lima St
- 316 E Lima St
Your Personal Tour Guide
Ask me questions while you tour the home.