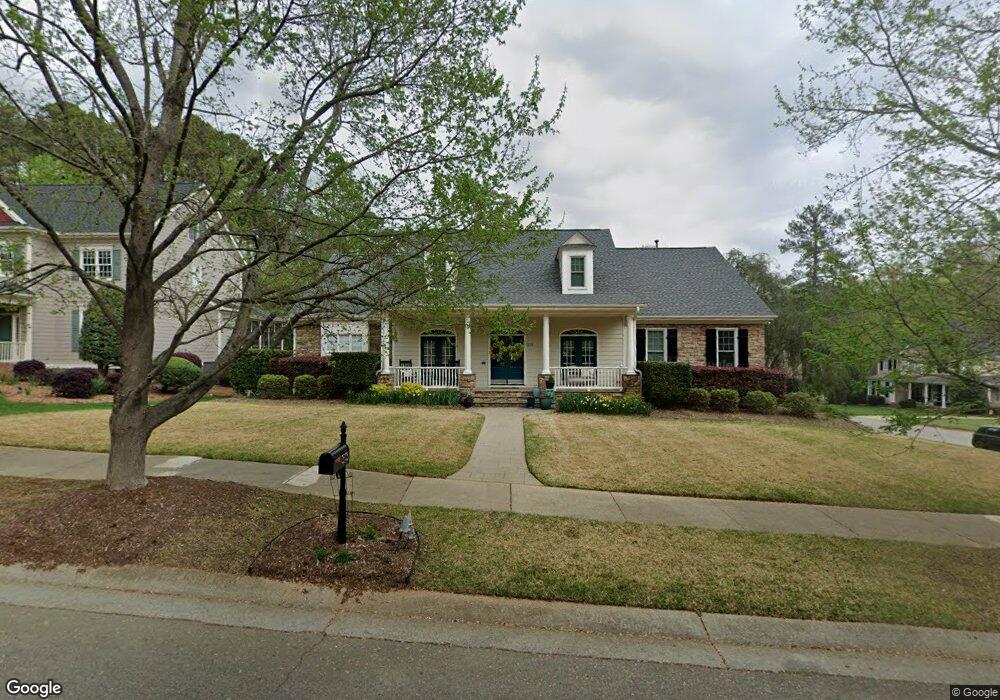
313 Flint Point Ln Holly Springs, NC 27540
Estimated Value: $910,920 - $1,046,000
4
Beds
4
Baths
3,743
Sq Ft
$266/Sq Ft
Est. Value
About This Home
This home is located at 313 Flint Point Ln, Holly Springs, NC 27540 and is currently estimated at $994,730, approximately $265 per square foot. 313 Flint Point Ln is a home located in Wake County with nearby schools including Holly Springs Elementary School, Holly Ridge Middle School, and Holly Springs High School.
Ownership History
Date
Name
Owned For
Owner Type
Purchase Details
Closed on
Jul 25, 2016
Sold by
Rooney Garry D and Rooney Kristina A
Bought by
Mayer Edwin Mark and Mayer Amy J
Current Estimated Value
Home Financials for this Owner
Home Financials are based on the most recent Mortgage that was taken out on this home.
Original Mortgage
$308,000
Outstanding Balance
$193,325
Interest Rate
3.54%
Mortgage Type
New Conventional
Estimated Equity
$801,405
Purchase Details
Closed on
Sep 4, 2007
Sold by
Hauser Richard A and Hauser Linda A
Bought by
Rooney Garry D and Rooney Kristina A
Home Financials for this Owner
Home Financials are based on the most recent Mortgage that was taken out on this home.
Original Mortgage
$250,000
Interest Rate
6.57%
Mortgage Type
Purchase Money Mortgage
Purchase Details
Closed on
Dec 30, 2002
Sold by
Djf Builders Inc
Bought by
Hauser Richard A and Hauser Linda A
Home Financials for this Owner
Home Financials are based on the most recent Mortgage that was taken out on this home.
Original Mortgage
$308,000
Interest Rate
5.92%
Create a Home Valuation Report for This Property
The Home Valuation Report is an in-depth analysis detailing your home's value as well as a comparison with similar homes in the area
Home Values in the Area
Average Home Value in this Area
Purchase History
| Date | Buyer | Sale Price | Title Company |
|---|---|---|---|
| Mayer Edwin Mark | $538,000 | None Available | |
| Rooney Garry D | $505,000 | None Available | |
| Hauser Richard A | $385,000 | -- |
Source: Public Records
Mortgage History
| Date | Status | Borrower | Loan Amount |
|---|---|---|---|
| Open | Mayer Edwin Mark | $308,000 | |
| Previous Owner | Rooney Garry D | $250,000 | |
| Previous Owner | Hauser Richard A | $308,000 | |
| Closed | Hauser Richard A | $60,950 |
Source: Public Records
Tax History Compared to Growth
Tax History
| Year | Tax Paid | Tax Assessment Tax Assessment Total Assessment is a certain percentage of the fair market value that is determined by local assessors to be the total taxable value of land and additions on the property. | Land | Improvement |
|---|---|---|---|---|
| 2025 | $7,552 | $875,221 | $150,000 | $725,221 |
| 2024 | $7,521 | $875,221 | $150,000 | $725,221 |
| 2023 | $6,262 | $578,666 | $78,000 | $500,666 |
| 2022 | $6,045 | $578,666 | $78,000 | $500,666 |
| 2021 | $5,932 | $578,666 | $78,000 | $500,666 |
| 2020 | $5,932 | $578,666 | $78,000 | $500,666 |
| 2019 | $6,346 | $525,776 | $78,000 | $447,776 |
| 2018 | $5,735 | $525,776 | $78,000 | $447,776 |
| 2017 | $5,528 | $525,776 | $78,000 | $447,776 |
| 2016 | $5,451 | $525,776 | $78,000 | $447,776 |
| 2015 | $5,544 | $526,358 | $78,000 | $448,358 |
| 2014 | $5,352 | $526,358 | $78,000 | $448,358 |
Source: Public Records
Map
Nearby Homes
- 112 Midden Way
- 228 Masden Rd
- 225 Old Ride Dr
- 0 Old Ride Dr
- 204 Chrismill Ln
- 208 Old Ride Dr
- 217 Jones Hill Rd
- 0/416 Holly Springs Rd
- 413 Rhamkatte Rd
- 204 Crossway Ln
- 129 Starwood Ln
- 215 Savannah Ridge Rd Unit 215
- 4924 Gable Ridge Ln
- 108 Warm Wood Ln
- 305 Savannah Ridge Rd
- 208 Apple Drupe Way
- 229 Amacord Way
- 4809 Greenpoint Ln
- 116 Cobblebrook Ct
- 137 Lacombe Ct
- 309 Flint Point Ln
- 104 Sunset Grove Dr
- 307 Flint Point Ln
- 105 Sunset Grove Dr
- 316 Flint Point Ln
- 305 Flint Point Ln
- 108 Sunset Grove Dr
- 109 Sunset Grove Dr
- 400 Flint Point Ln
- 308 Flint Point Ln
- 109 Midden Way
- 105 Midden Way
- 113 Sunset Grove Dr
- 117 Sunset Grove Dr
- 301 Flint Point Ln
- 304 Flint Point Ln
- 101 Midden Way
- 100 Masden Rd Unit Lot 239
- 405 Flint Point Ln Unit Lot 240
- 105 Daisy Grove Ln Unit Lot 225