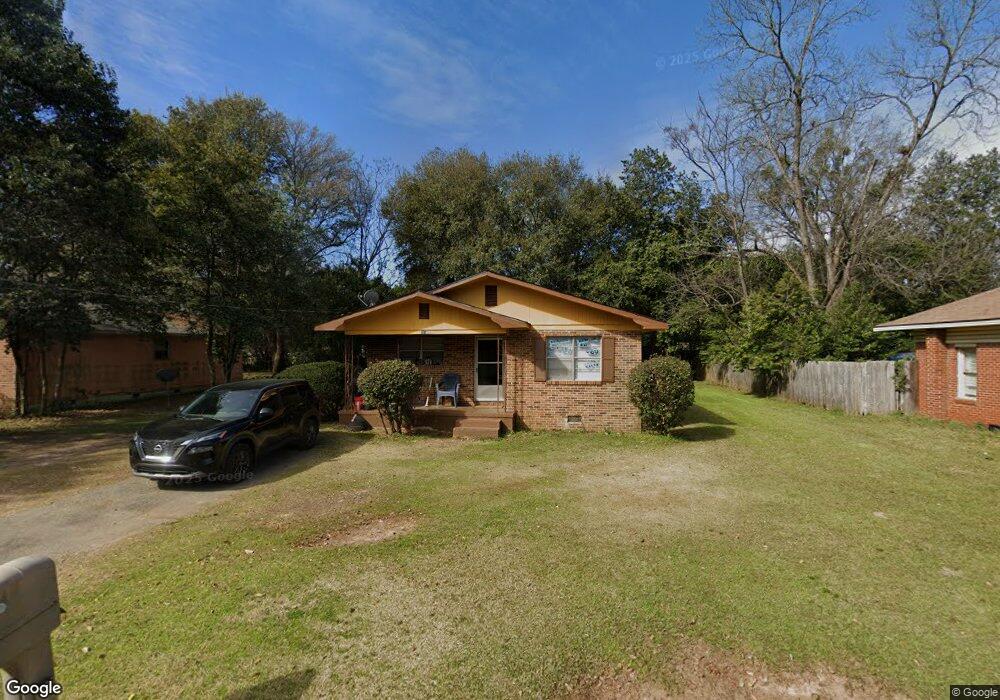
313 Hiley St Fort Valley, GA 31030
Estimated Value: $68,586 - $132,000
3
Beds
1
Bath
1,032
Sq Ft
$92/Sq Ft
Est. Value
About This Home
This home is located at 313 Hiley St, Fort Valley, GA 31030 and is currently estimated at $95,397, approximately $92 per square foot. 313 Hiley St is a home located in Peach County with nearby schools including Kay Road Elementary School, Fort Valley Middle School, and Peach County High School.
Ownership History
Date
Name
Owned For
Owner Type
Purchase Details
Closed on
Aug 10, 2023
Sold by
Turner Ronnesha
Bought by
Bryant Frankie
Current Estimated Value
Purchase Details
Closed on
Jan 13, 2023
Sold by
Turner Daria
Bought by
Bryant Frankie
Purchase Details
Closed on
Dec 28, 2022
Sold by
Bryant Jacqueline Rene Estate
Bought by
Bryant Frankie and Sutherland Brittany
Purchase Details
Closed on
Feb 5, 2013
Sold by
Roro Investments Llc
Bought by
Bryant Frankie Lee and Bryant Jacqueline Rene
Purchase Details
Closed on
Aug 15, 2007
Sold by
Walton James M
Bought by
Roro Investments Llc
Purchase Details
Closed on
Apr 10, 2003
Sold by
Walden Louise
Bought by
Walton James M
Purchase Details
Closed on
Dec 7, 1990
Sold by
Mcgee C E
Bought by
Walden Louise
Purchase Details
Closed on
Mar 6, 1990
Sold by
Coleman Arthur and Coleman Daisy
Bought by
Mcgee C E
Create a Home Valuation Report for This Property
The Home Valuation Report is an in-depth analysis detailing your home's value as well as a comparison with similar homes in the area
Home Values in the Area
Average Home Value in this Area
Purchase History
| Date | Buyer | Sale Price | Title Company |
|---|---|---|---|
| Bryant Frankie | -- | -- | |
| Bryant Frankie | -- | -- | |
| Bryant Frankie | -- | -- | |
| Bryant Frankie | -- | -- | |
| Bryant Frankie Lee | -- | -- | |
| Roro Investments Llc | $17,500 | -- | |
| Walton James M | -- | -- | |
| Walton James M | $21,000 | -- | |
| Walden Louise | -- | -- | |
| Mcgee C E | -- | -- |
Source: Public Records
Tax History Compared to Growth
Tax History
| Year | Tax Paid | Tax Assessment Tax Assessment Total Assessment is a certain percentage of the fair market value that is determined by local assessors to be the total taxable value of land and additions on the property. | Land | Improvement |
|---|---|---|---|---|
| 2024 | $649 | $15,560 | $2,000 | $13,560 |
| 2023 | $358 | $13,400 | $1,640 | $11,760 |
| 2022 | $339 | $12,600 | $1,640 | $10,960 |
| 2021 | $317 | $10,160 | $1,600 | $8,560 |
| 2020 | $601 | $13,000 | $1,600 | $11,400 |
| 2019 | $603 | $13,000 | $1,600 | $11,400 |
| 2018 | $605 | $13,000 | $1,600 | $11,400 |
| 2017 | $566 | $13,000 | $1,600 | $11,400 |
| 2016 | $632 | $14,560 | $1,600 | $12,960 |
| 2015 | $460 | $14,560 | $1,600 | $12,960 |
| 2014 | $461 | $14,560 | $1,600 | $12,960 |
| 2013 | -- | $14,560 | $1,600 | $12,960 |
Source: Public Records
Map
Nearby Homes
- 507 Burnett St
- 403 Vienna St Unit 8
- 108 Vienna St
- 805 E Church St
- 701 E Church St
- 209 Valley Dr
- 203 Vienna Cir
- 502 Peachtree St
- 2690 E Lawson Merritt Rd
- 209 Calhoun St
- 301 Oak St
- 206 Peachtree St
- 112 Plum St
- 509 Anderson Ave
- 412 Walden St
- 120 Jamie Ct
- LOT 10 Taylors Mill Rd
- Lot 7 & 8 Taylors Mill Rd
- 514 Hinton St
- 1598 N Taylor Mills Roads