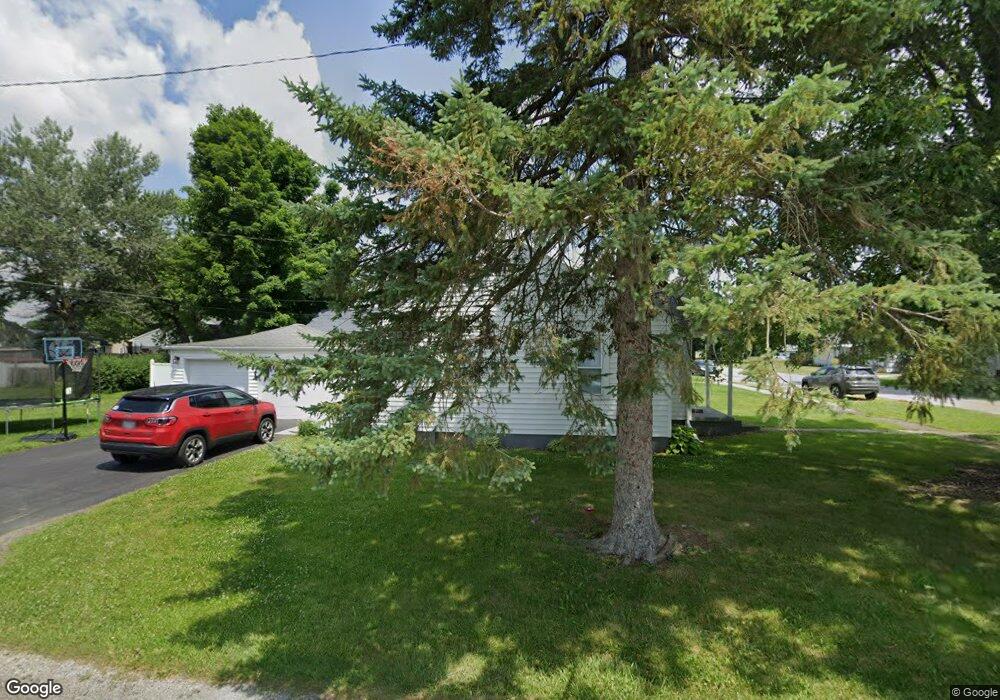
313 Independence Ave Fostoria, OH 44830
Estimated Value: $65,000 - $119,000
2
Beds
1
Bath
755
Sq Ft
$112/Sq Ft
Est. Value
About This Home
This home is located at 313 Independence Ave, Fostoria, OH 44830 and is currently estimated at $84,374, approximately $111 per square foot. 313 Independence Ave is a home located in Hancock County with nearby schools including Fostoria Intermediate Elementary School and Fostoria Junior/Senior High School.
Ownership History
Date
Name
Owned For
Owner Type
Purchase Details
Closed on
May 3, 2022
Sold by
Roland Huffman
Bought by
Huffman Matthew
Current Estimated Value
Purchase Details
Closed on
Jun 12, 2012
Sold by
Stark Lois M and Mcdowell Diana A
Bought by
Huffman Roland
Purchase Details
Closed on
Jun 16, 1993
Bought by
Stark Richard M and Stark Lois M
Purchase Details
Closed on
Jul 6, 1989
Bought by
Stark Richard M and Stark Lois M
Purchase Details
Closed on
Oct 13, 1983
Bought by
Carnahan Othal M and Carnahan Arlene
Create a Home Valuation Report for This Property
The Home Valuation Report is an in-depth analysis detailing your home's value as well as a comparison with similar homes in the area
Home Values in the Area
Average Home Value in this Area
Purchase History
| Date | Buyer | Sale Price | Title Company |
|---|---|---|---|
| Huffman Matthew | $35,000 | None Listed On Document | |
| Huffman Roland | $20,000 | Wolph Title Inc | |
| Stark Richard M | -- | -- | |
| Stark Richard M | $29,900 | -- | |
| Carnahan Othal M | $20,000 | -- |
Source: Public Records
Tax History Compared to Growth
Tax History
| Year | Tax Paid | Tax Assessment Tax Assessment Total Assessment is a certain percentage of the fair market value that is determined by local assessors to be the total taxable value of land and additions on the property. | Land | Improvement |
|---|---|---|---|---|
| 2024 | $986 | $19,810 | $3,900 | $15,910 |
| 2023 | $984 | $19,810 | $3,900 | $15,910 |
| 2022 | $1,072 | $19,810 | $3,900 | $15,910 |
| 2021 | $973 | $16,930 | $4,110 | $12,820 |
| 2020 | $978 | $16,930 | $4,110 | $12,820 |
| 2019 | $973 | $16,930 | $4,110 | $12,820 |
| 2018 | $872 | $14,790 | $3,570 | $11,220 |
| 2017 | $436 | $14,790 | $3,570 | $11,220 |
| 2016 | $769 | $14,790 | $3,570 | $11,220 |
| 2015 | $797 | $12,930 | $3,570 | $9,360 |
| 2014 | $668 | $12,890 | $3,570 | $9,320 |
| 2012 | $779 | $14,940 | $3,570 | $11,370 |
Source: Public Records
Map
Nearby Homes
- 411 Monticello Dr
- 509 College Ave
- 351 W South St
- 348 W South St
- 461 W Lytle St
- 461 W Lytle St Unit 145
- 461 W Lytle St Unit 106
- 418 W Ridge Dr
- 425 W Ridge Dr
- 203 N Union St
- 603 N Vine St
- 1401 Van Buren St
- 0 W South Route 12
- 520 N Union St
- 723 N Union St
- 901 Central Ave
- 211 Summit St
- 435 Park Ave
- 892 N Countyline St
- 931 N Union St
- 101 Atkins Ave
- 309 Independence Ave
- 240 Elwood Ave
- 238 Elwood Ave
- 409 Independence Ave
- 308 Independence Ave
- 228 Elwood Ave
- 228 Elwood Ave
- 406 Independence Ave
- 300 Elwood Ave
- 306 Independence Ave
- 412 Independence Ave
- 415 Independence Ave
- 224 Elwood Ave
- 119 Washington St
- 239 Elwood Ave
- 115 Washington St
- 235 Elwood Ave
- 220 Elwood Ave
- 308 Elwood Ave