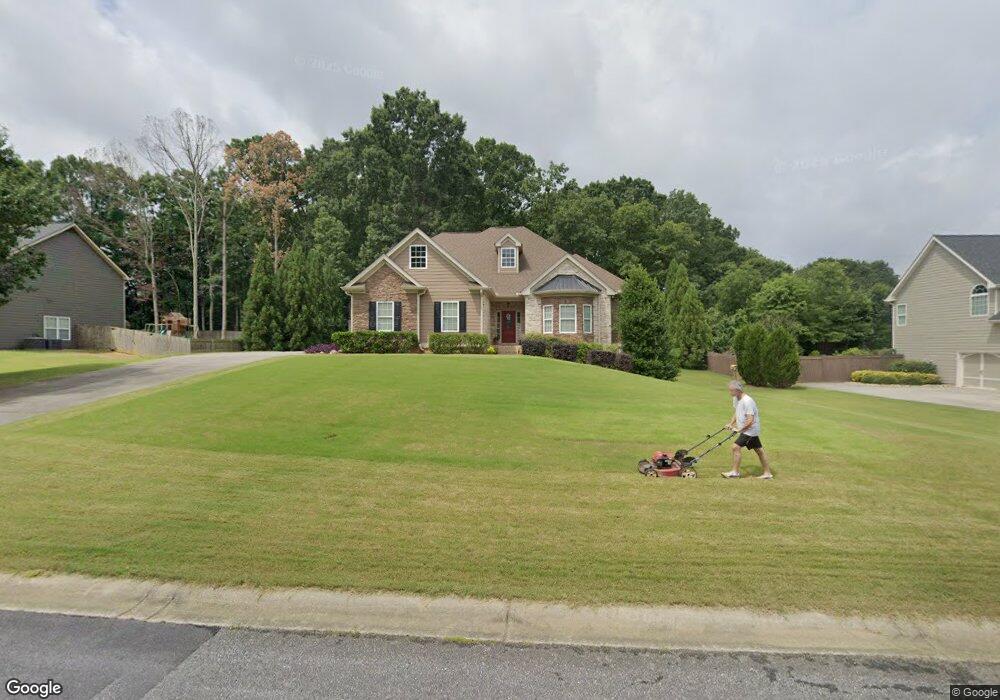
313 Junction Ct Winder, GA 30680
Estimated Value: $420,273 - $477,000
4
Beds
4
Baths
2,517
Sq Ft
$180/Sq Ft
Est. Value
About This Home
This home is located at 313 Junction Ct, Winder, GA 30680 and is currently estimated at $453,568, approximately $180 per square foot. 313 Junction Ct is a home located in Barrow County with nearby schools including Kennedy Elementary School, Westside Middle School, and Apalachee High School.
Ownership History
Date
Name
Owned For
Owner Type
Purchase Details
Closed on
Mar 12, 2008
Sold by
Federal Home Loan Mortgage Corporation
Bought by
Ausec Daniel W and Dail Charles
Current Estimated Value
Home Financials for this Owner
Home Financials are based on the most recent Mortgage that was taken out on this home.
Original Mortgage
$225,000
Outstanding Balance
$136,679
Interest Rate
5.62%
Mortgage Type
New Conventional
Estimated Equity
$316,889
Purchase Details
Closed on
Jan 2, 2008
Sold by
Taylor Bean Whitaker
Bought by
Federal Home Loan Mortgage Corporation
Purchase Details
Closed on
Jan 22, 2007
Sold by
Creekview Ents Inc
Bought by
Watkins Theo and Watkins Betty
Home Financials for this Owner
Home Financials are based on the most recent Mortgage that was taken out on this home.
Original Mortgage
$244,000
Interest Rate
6.07%
Mortgage Type
New Conventional
Purchase Details
Closed on
Dec 1, 2004
Sold by
Montana Development Inc
Bought by
Creekview Enterprises Inc
Purchase Details
Closed on
Mar 19, 2004
Bought by
Montana Development Inc
Create a Home Valuation Report for This Property
The Home Valuation Report is an in-depth analysis detailing your home's value as well as a comparison with similar homes in the area
Home Values in the Area
Average Home Value in this Area
Purchase History
| Date | Buyer | Sale Price | Title Company |
|---|---|---|---|
| Ausec Daniel W | -- | -- | |
| Federal Home Loan Mortgage Corporation | -- | -- | |
| Taylor Bean Whitaker Mtg Corp | $181,349 | -- | |
| Watkins Theo | -- | -- | |
| Creekview Enterprises Inc | $691,600 | -- | |
| Montana Development Inc | -- | -- |
Source: Public Records
Mortgage History
| Date | Status | Borrower | Loan Amount |
|---|---|---|---|
| Open | Ausec Daniel W | $225,000 | |
| Previous Owner | Watkins Theo | $244,000 |
Source: Public Records
Tax History
| Year | Tax Paid | Tax Assessment Tax Assessment Total Assessment is a certain percentage of the fair market value that is determined by local assessors to be the total taxable value of land and additions on the property. | Land | Improvement |
|---|---|---|---|---|
| 2025 | $1,129 | $142,400 | $22,000 | $120,400 |
| 2024 | $2,156 | $139,270 | $22,000 | $117,270 |
| 2023 | $1,765 | $139,870 | $22,000 | $117,870 |
| 2022 | $3,243 | $114,237 | $22,000 | $92,237 |
| 2021 | $3,427 | $114,237 | $22,000 | $92,237 |
| 2020 | $3,262 | $108,572 | $20,000 | $88,572 |
| 2019 | $3,207 | $104,906 | $20,000 | $84,906 |
| 2018 | $2,992 | $98,840 | $17,600 | $81,240 |
| 2017 | $2,333 | $80,116 | $17,600 | $62,516 |
| 2016 | $2,151 | $72,388 | $17,600 | $54,788 |
| 2015 | $2,178 | $72,977 | $17,600 | $55,377 |
| 2014 | $1,959 | $64,590 | $8,624 | $55,966 |
| 2013 | -- | $61,006 | $8,624 | $52,382 |
Source: Public Records
Map
Nearby Homes
- 134 Dunedin Dr
- 0 Carson Wages Rd Unit 7617509
- 0 Carson Wages Rd Unit 10348307
- 0 Monroe Hwy Unit 7530054
- 0 Monroe Hwy Unit 10466108
- 22 Mallard Creek Way
- 29 Arbor Way
- 14 Smithwood Dr
- 236 Vision St
- 176 Market St
- 106 Carterdale Ct Unit 1
- 755 Harry McCarty Rd
- 435 Watson Rd
- 670 Loganville Hwy
- 1048 Sutherland Dr
- 328 Advent Dr
- 99 Rivington Dr
- 1053 Sutherland Dr
- 102 Rivington Dr
- 203 Nativity Cove
- 315 Junction Ct Unit 7A
- 315 Junction Ct
- 311 Junction Ct
- 317 Junction Ct
- 316 Junction Ct
- 314 Junction Ct
- 319 Junction Ct
- 318 Junction Ct
- 304 Junction Ct
- 309 Junction Ct
- 527 Windy Trail
- 320 Junction Ct
- 321 Junction Ct
- 525 Windy Trail
- 58 Punkin Junction Rd
- 64 Punkin Junction Rd
- 322 Junction Ct
- 302 Junction Ct
- 305 Junction Ct
- 526 Windy Trail Unit 10
Your Personal Tour Guide
Ask me questions while you tour the home.