Estimated Value: $192,000 - $223,000
4
Beds
2
Baths
1,836
Sq Ft
$110/Sq Ft
Est. Value
About This Home
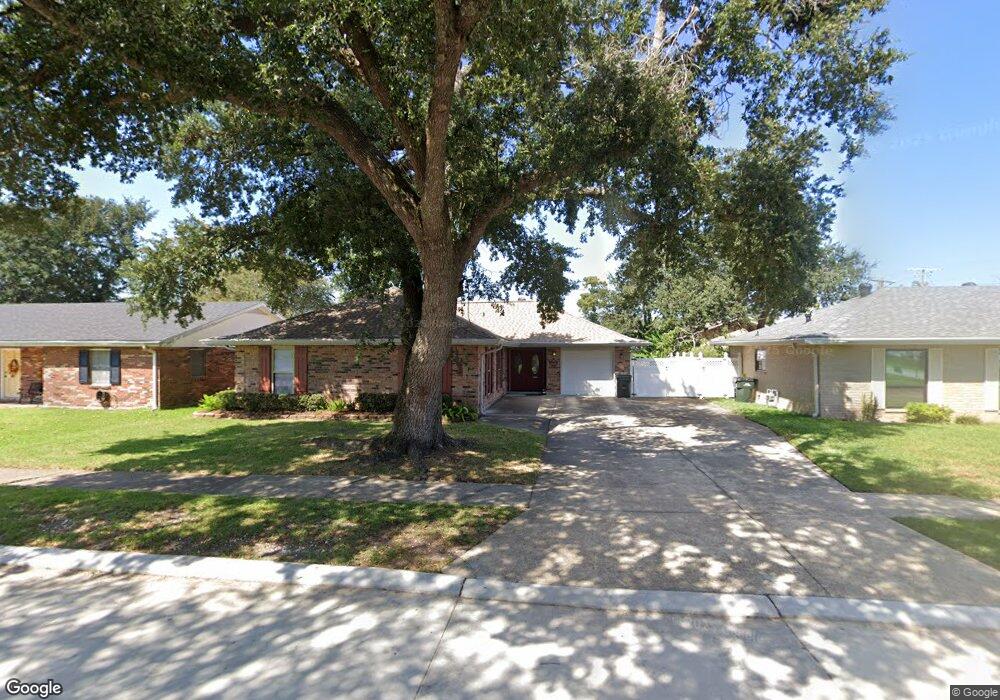
This home is located at 313 Malibou Blvd, Houma, LA 70364 and is currently estimated at $201,775, approximately $109 per square foot. 313 Malibou Blvd is a home located in Terrebonne Parish with nearby schools including Lisa Park Elementary School, Houma Junior High School, and Terrebonne High School.
Ownership History
Date
Name
Owned For
Owner Type
Purchase Details
Closed on
Sep 6, 2019
Sold by
Norris Thomas W
Bought by
Hardey Felicia
Current Estimated Value
Home Financials for this Owner
Home Financials are based on the most recent Mortgage that was taken out on this home.
Original Mortgage
$128,000
Outstanding Balance
$84,887
Interest Rate
3.6%
Mortgage Type
New Conventional
Estimated Equity
$116,888
Purchase Details
Closed on
Jul 18, 2018
Sold by
Nationstar Mortgage Llc
Bought by
Norris Thomas W
Home Financials for this Owner
Home Financials are based on the most recent Mortgage that was taken out on this home.
Original Mortgage
$117,643
Interest Rate
4.5%
Mortgage Type
Unknown
Purchase Details
Closed on
Jun 26, 2009
Sold by
King Ronald Mitchell and King Betty
Bought by
Marie Jenni Lynn
Home Financials for this Owner
Home Financials are based on the most recent Mortgage that was taken out on this home.
Original Mortgage
$172,448
Interest Rate
4.97%
Mortgage Type
Purchase Money Mortgage
Create a Home Valuation Report for This Property
The Home Valuation Report is an in-depth analysis detailing your home's value as well as a comparison with similar homes in the area
Home Values in the Area
Average Home Value in this Area
Purchase History
| Date | Buyer | Sale Price | Title Company |
|---|---|---|---|
| Hardey Felicia | $160,000 | -- | |
| Norris Thomas W | $130,500 | -- | |
| Marie Jenni Lynn | $166,000 | Alliance Title Llc |
Source: Public Records
Mortgage History
| Date | Status | Borrower | Loan Amount |
|---|---|---|---|
| Open | Hardey Felicia | $128,000 | |
| Previous Owner | Norris Thomas W | $117,643 | |
| Previous Owner | Marie Jenni Lynn | $172,448 |
Source: Public Records
Tax History Compared to Growth
Tax History
| Year | Tax Paid | Tax Assessment Tax Assessment Total Assessment is a certain percentage of the fair market value that is determined by local assessors to be the total taxable value of land and additions on the property. | Land | Improvement |
|---|---|---|---|---|
| 2024 | $865 | $16,540 | $3,000 | $13,540 |
| 2023 | $865 | $14,090 | $2,320 | $11,770 |
| 2022 | $614 | $14,090 | $2,320 | $11,770 |
| 2021 | $492 | $12,910 | $2,320 | $10,590 |
| 2020 | $1,213 | $14,090 | $2,320 | $11,770 |
| 2019 | $1,240 | $13,230 | $2,020 | $11,210 |
| 2018 | $1,201 | $12,600 | $1,920 | $10,680 |
| 2017 | $1,210 | $12,600 | $1,920 | $10,680 |
| 2015 | $430 | $12,005 | $1,830 | $10,175 |
| 2014 | $428 | $12,005 | $0 | $0 |
| 2013 | $424 | $12,005 | $0 | $0 |
Source: Public Records
Map
Nearby Homes
- 300 Malibou Blvd
- 410 Harding Dr
- 307 Harding Dr
- 306 Derusso St
- 316 Louis Dr
- 226 Derusso St
- 205 Harding Dr
- 220 Derusso St
- 421 Cavaness Dr
- 515 Harding Dr
- 230 Derusso St
- 605 Westview Dr
- 115 Louis Dr
- 6527 Jana St
- 516 Cavaness Dr
- 298 Marie Claire Dr
- 284 Marie Claire Dr
- 249 Marie Claire Dr
- 6541 W Park Ave
- 304 Holiday Dr
- 315 Malibou Blvd
- 311 Malibou Blvd
- 312 Westview Dr
- 314 Westview Dr
- 310 Westview Dr
- 309 Malibou Blvd
- 310 Westview Dr
- 312 Malibou Blvd
- 308 Westview Dr
- 314 Malibou Blvd
- 310 Malibou Blvd
- 307 Malibou Blvd
- 308 Malibou Blvd
- 306 Westview Dr
- 306 Malibou Blvd
- 313 Westview Dr
- 311 Westview Dr
- 315 Westview Dr
- 305 Malibou Blvd
- 313 Richard Dr