Estimated Value: $117,000 - $4,128,000
Studio
--
Bath
1,197
Sq Ft
$1,726/Sq Ft
Est. Value
About This Home
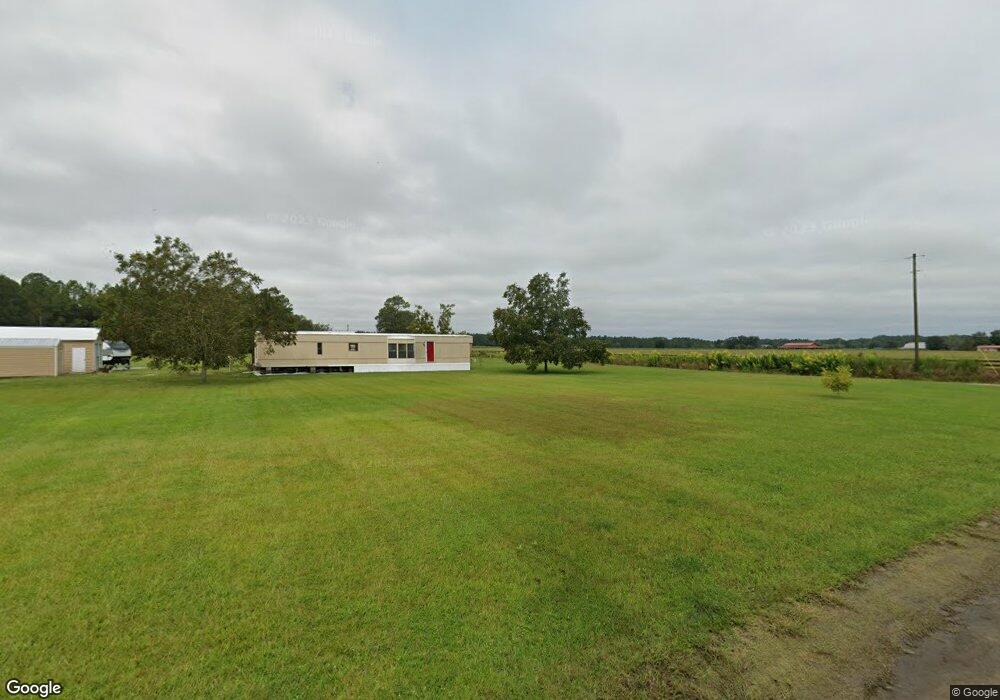
This home is located at 313 Meadow Rd, Alma, GA 31510 and is currently estimated at $2,065,669, approximately $1,725 per square foot. 313 Meadow Rd is a home with nearby schools including Bacon County Primary School, Bacon County Elementary School, and Bacon County Middle School.
Ownership History
Date
Name
Owned For
Owner Type
Purchase Details
Closed on
May 13, 2013
Sold by
Boatright Gregory Neal
Bought by
Davis Gregory A
Current Estimated Value
Purchase Details
Closed on
Mar 23, 2012
Sold by
Johnson Benjamin H
Bought by
Boatright Gregory Neal
Purchase Details
Closed on
Oct 4, 2010
Sold by
Johnson Deborah K
Bought by
Johnson Benjamin H and Johnson Janet H
Purchase Details
Closed on
Aug 17, 2009
Sold by
Johnson Frank E
Bought by
Johnson Benjamin H and Johnson Janet H
Purchase Details
Closed on
Dec 16, 2008
Sold by
Johnson Benjamin Hal
Bought by
Johnson Janet H
Purchase Details
Closed on
Jan 31, 2007
Sold by
Johnson Frank E
Bought by
Johnson Deborah K and Johnson Gary L
Purchase Details
Closed on
Dec 28, 2001
Sold by
Johnson Frank
Bought by
Johnson Frank
Purchase Details
Closed on
Jun 18, 1993
Bought by
Johnson Frank
Create a Home Valuation Report for This Property
The Home Valuation Report is an in-depth analysis detailing your home's value as well as a comparison with similar homes in the area
Home Values in the Area
Average Home Value in this Area
Purchase History
We collect this data history from publicly available records. To have your information removed, we recommend requesting removal directly through your county’s website.
| Date | Buyer | Sale Price | Title Company |
|---|---|---|---|
| Davis Gregory A | $40,000 | -- | |
| Boatright Gregory Neal | $1,384,240 | -- | |
| Johnson Benjamin H | -- | -- | |
| Johnson Benjamin H | -- | -- | |
| Johnson Janet H | -- | -- | |
| Johnson Deborah K | -- | -- | |
| Johnson Benjamin H | -- | -- | |
| Johnson Frank | -- | -- | |
| Johnson Frank | $663,100 | -- |
Source: Public Records
Tax History
| Year | Tax Paid | Tax Assessment Tax Assessment Total Assessment is a certain percentage of the fair market value that is determined by local assessors to be the total taxable value of land and additions on the property. | Land | Improvement |
|---|---|---|---|---|
| 2025 | $6,778 | $873,344 | $832,280 | $41,064 |
| 2024 | $7,367 | $765,744 | $726,880 | $38,864 |
| 2023 | $7,401 | $761,904 | $726,880 | $35,024 |
| 2022 | $6,597 | $750,784 | $726,880 | $23,904 |
| 2021 | $6,533 | $748,424 | $726,880 | $21,544 |
| 2020 | $6,625 | $563,100 | $543,531 | $19,569 |
| 2019 | $6,462 | $563,100 | $543,531 | $19,569 |
| 2018 | $6,279 | $562,128 | $543,531 | $18,597 |
| 2017 | $16,148 | $562,128 | $543,531 | $18,597 |
| 2016 | $5,962 | $562,128 | $543,531 | $18,597 |
| 2015 | $5,796 | $562,007 | $543,531 | $18,476 |
| 2014 | $5,938 | $562,007 | $543,531 | $18,476 |
| 2013 | $5,938 | $237,884 | $218,446 | $19,438 |
Source: Public Records
Map
Nearby Homes
- 325 New Hope Church Rd
- 00 Beaufort Rd & Warnock Rd
- 0 (35.01 Acres) Bacon School Rd
- 1749 US Highway 1 N
- 512 Bennett Still Hwy
- W 4th St
- Stewart Cemetery Rd
- 0 Stewart Cemetery Rd Unit 10650398
- 0 Lake Lure Dr
- 907 N Pierce St
- 401 Lee St
- 702 N Church St
- 0 Myra St Unit 10740796
- 701 Smallee St
- 0 W 4th Street Extension Unit 10650393
- 606 W 7th St
- 1608 W 4th St
- 9TH E 417
- 311 Douglas St
- 136 Morris Dr
- 361 Meadowlark Rd
- 246 Meadowlark Rd
- 205 Meadowlark Rd
- 261 Chinchilla Rd
- 130 Hart Ln
- 168 Meadowlark Rd
- 161 Meadowlark Rd
- 254 Wren Rd
- 2483 Us Highway 1 N
- 0 Big Creek Church Rd
- 00000 Big Creek Church Rd
- 2601 Us Highway 1 N
- 2303 Us Highway 1 N
- 2540 Us Highway 1 N
- 112 New Hope Church Rd
- 103 New Hope Church Rd
- 1243 Big Creek Church Rd
Your Personal Tour Guide
Ask me questions while you tour the home.