Estimated Value: $278,373 - $382,000
--
Bed
--
Bath
2,029
Sq Ft
$171/Sq Ft
Est. Value
About This Home
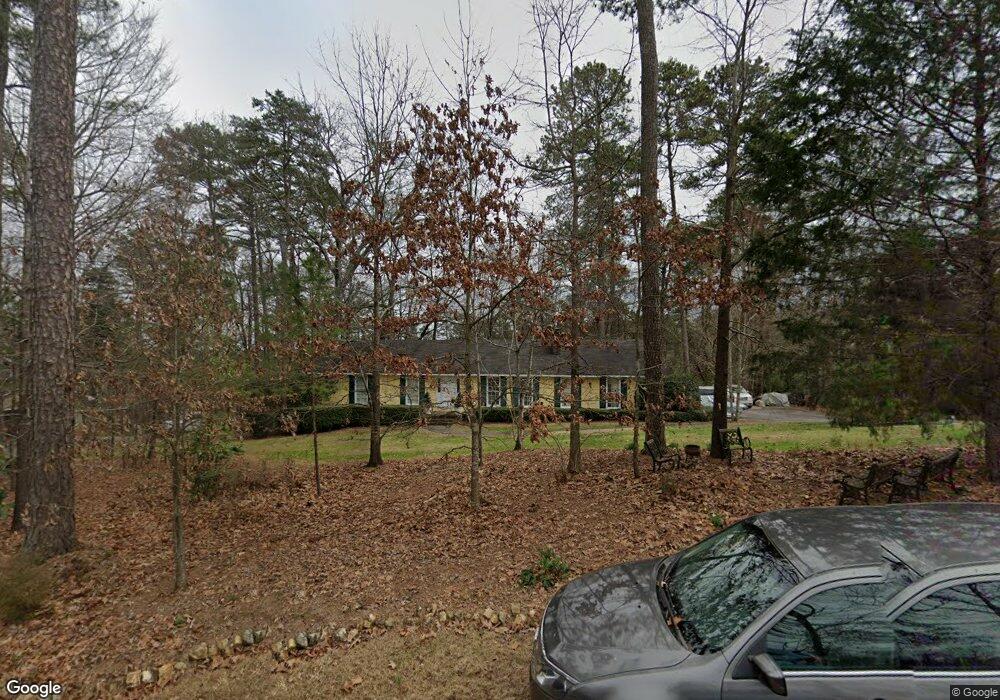
This home is located at 313 Mount Alto Rd SW, Rome, GA 30165 and is currently estimated at $346,843, approximately $170 per square foot. 313 Mount Alto Rd SW is a home located in Floyd County with nearby schools including Coosa Middle School, Coosa High School, and Darlington School.
Ownership History
Date
Name
Owned For
Owner Type
Purchase Details
Closed on
May 3, 1995
Sold by
Roes Brett A
Bought by
Henson Scott and Alicia Henson
Current Estimated Value
Purchase Details
Closed on
Jun 17, 1994
Sold by
Goss W E P
Bought by
Roes Brett A
Purchase Details
Closed on
Oct 10, 1991
Bought by
P and R
Purchase Details
Closed on
Feb 25, 1991
Sold by
Brown Joy Goss
Bought by
Goss W E P
Purchase Details
Closed on
Mar 4, 1990
Sold by
Brown Harvey C and Brown Joy G
Bought by
Brown Joy Goss
Purchase Details
Closed on
Oct 6, 1988
Sold by
Brown Harvey C Jf and Joy Goss
Bought by
Brown Harvey C and Brown Joy G
Purchase Details
Closed on
Jun 3, 1977
Sold by
P\R
Bought by
Brown Harvey C Jf and Joy Goss
Purchase Details
Closed on
Dec 2, 1975
Sold by
Vernon Joe L and Vernon Phyllis S
Bought by
P\R
Purchase Details
Closed on
Mar 28, 1975
Sold by
Mccrary Sara R Etal
Bought by
Vernon Joe L and Vernon Phyllis S
Purchase Details
Closed on
Jan 1, 1901
Bought by
Mccrary Sara R Etal
Create a Home Valuation Report for This Property
The Home Valuation Report is an in-depth analysis detailing your home's value as well as a comparison with similar homes in the area
Home Values in the Area
Average Home Value in this Area
Purchase History
| Date | Buyer | Sale Price | Title Company |
|---|---|---|---|
| Henson Scott | $144,000 | -- | |
| Roes Brett A | $113,300 | -- | |
| P | -- | -- | |
| Goss W E P | $15,000 | -- | |
| Brown Joy Goss | -- | -- | |
| Brown Harvey C | -- | -- | |
| Brown Harvey C Jf | $64,000 | -- | |
| P\R | $6,300 | -- | |
| Vernon Joe L | -- | -- | |
| Mccrary Sara R Etal | -- | -- |
Source: Public Records
Tax History Compared to Growth
Tax History
| Year | Tax Paid | Tax Assessment Tax Assessment Total Assessment is a certain percentage of the fair market value that is determined by local assessors to be the total taxable value of land and additions on the property. | Land | Improvement |
|---|---|---|---|---|
| 2024 | $1,891 | $113,258 | $17,172 | $96,086 |
| 2023 | $1,991 | $109,288 | $15,264 | $94,024 |
| 2022 | $2,275 | $92,583 | $12,720 | $79,863 |
| 2021 | $2,191 | $85,920 | $12,720 | $73,200 |
| 2020 | $2,098 | $79,957 | $9,540 | $70,417 |
| 2019 | $1,922 | $71,509 | $9,540 | $61,969 |
| 2018 | $1,873 | $68,650 | $9,540 | $59,110 |
| 2017 | $1,812 | $65,148 | $9,540 | $55,608 |
| 2016 | $1,822 | $64,485 | $9,520 | $54,965 |
| 2015 | $1,786 | $64,485 | $9,520 | $54,965 |
| 2014 | $1,786 | $64,485 | $9,520 | $54,965 |
Source: Public Records
Map
Nearby Homes
- 27 Bluff Mountain Dr SW
- 4 Wayne St SW
- 28 Mountain Crest Dr SW
- 2 Wayne St SW
- 20 Pine Valley Rd SW
- 17 Wilkerson Rd SW
- 16 Wilkerson Rd SW
- 13 Ridgewood Rd SW
- 0 Mount Alto Rd SW Unit 10523740
- 28 Crestwood Dr SW
- 202 Green View Rd SW
- 14 Berckman Ln SW
- 19 Berckman Ln SW
- 3 Berckman Ln SW
- 415 Wilson Ave SW
- 17 Rosewood Rd SW
- 50 Melton Ave SW
- 0 Featherston Rd SW Unit 10512723
- 0 Featherston Rd SW Unit 13890394
- 6 Horseleg Creek Rd SW
- 313 Mount Alto Rd SW
- 311 Mount Alto Rd SW
- 315 Mount Alto Rd SW
- 316 Mount Alto Rd SW
- 319 Mount Alto Rd SW
- 300 Mount Alto Rd SW
- 43 Bluff Mountain Dr SW
- 320 Mount Alto Rd SW
- 323 Mount Alto Rd SW
- 39 Bluff Mountain Dr SW
- 325 Mount Alto Rd SW
- 324 Mount Alto Rd SW
- 7 Bluff Mountain Dr SW
- 40 Bluff Mountain Dr SW
- 40 Bluff Mountain Dr SW
- 55 Mountain Crest Dr SW Unit 29
- 55 Mountain Crest Dr SW
- 35 Bluff Mountain Dr SW
- 326 Mount Alto Rd SW
- 327 Mount Alto Rd SW