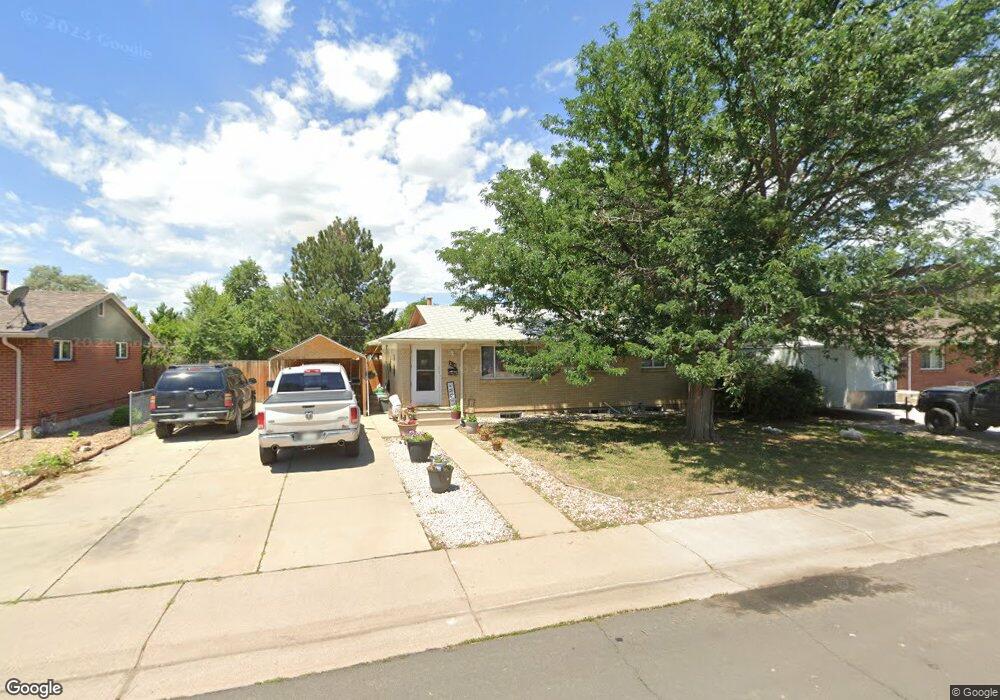
313 N 11th Ct Brighton, CO 80601
Estimated Value: $312,988 - $389,000
4
Beds
2
Baths
1,950
Sq Ft
$189/Sq Ft
Est. Value
About This Home
This home is located at 313 N 11th Ct, Brighton, CO 80601 and is currently estimated at $368,997, approximately $189 per square foot. 313 N 11th Ct is a home located in Adams County with nearby schools including Northeast Elementary School, Overland Trail Middle School, and Brighton High School.
Ownership History
Date
Name
Owned For
Owner Type
Purchase Details
Closed on
Mar 23, 2024
Sold by
Rios Felipe
Bought by
Martinez Stephanie Rios
Current Estimated Value
Purchase Details
Closed on
Aug 6, 2009
Sold by
The Bank Of New York
Bought by
Rlos Fellpe
Purchase Details
Closed on
Jul 9, 2009
Sold by
Garcia Nicolas
Bought by
The Bank Of New York
Purchase Details
Closed on
Sep 2, 2004
Sold by
Garcia Nicolas and Troncoso Jose
Bought by
Garcia Nicolas
Home Financials for this Owner
Home Financials are based on the most recent Mortgage that was taken out on this home.
Original Mortgage
$177,000
Interest Rate
7%
Mortgage Type
New Conventional
Purchase Details
Closed on
Oct 25, 2002
Sold by
Contreras Jose F and Contreras Alicia
Bought by
Garcia Nicolas and Troncoso Jose
Home Financials for this Owner
Home Financials are based on the most recent Mortgage that was taken out on this home.
Original Mortgage
$155,001
Interest Rate
6.13%
Mortgage Type
FHA
Create a Home Valuation Report for This Property
The Home Valuation Report is an in-depth analysis detailing your home's value as well as a comparison with similar homes in the area
Home Values in the Area
Average Home Value in this Area
Purchase History
| Date | Buyer | Sale Price | Title Company |
|---|---|---|---|
| Martinez Stephanie Rios | -- | None Listed On Document | |
| Rlos Fellpe | $84,000 | North American Title Company | |
| The Bank Of New York | -- | None Available | |
| Garcia Nicolas | -- | Title America | |
| Garcia Nicolas | $157,435 | -- |
Source: Public Records
Mortgage History
| Date | Status | Borrower | Loan Amount |
|---|---|---|---|
| Previous Owner | Garcia Nicolas | $177,000 | |
| Previous Owner | Garcia Nicolas | $155,001 |
Source: Public Records
Tax History
| Year | Tax Paid | Tax Assessment Tax Assessment Total Assessment is a certain percentage of the fair market value that is determined by local assessors to be the total taxable value of land and additions on the property. | Land | Improvement |
|---|---|---|---|---|
| 2025 | $2,441 | $24,340 | $5,780 | $18,560 |
| 2024 | $2,441 | $22,370 | $5,310 | $17,060 |
| 2023 | $2,429 | $25,770 | $5,410 | $20,360 |
| 2022 | $2,105 | $19,160 | $4,930 | $14,230 |
| 2021 | $1,973 | $19,160 | $4,930 | $14,230 |
| 2020 | $1,775 | $17,970 | $4,860 | $13,110 |
| 2019 | $1,776 | $17,970 | $4,860 | $13,110 |
| 2018 | $1,404 | $14,200 | $4,750 | $9,450 |
| 2017 | $1,402 | $14,200 | $4,750 | $9,450 |
| 2016 | $1,272 | $12,840 | $2,390 | $10,450 |
| 2015 | $1,270 | $12,840 | $2,390 | $10,450 |
| 2014 | -- | $9,610 | $1,910 | $7,700 |
Source: Public Records
Map
Nearby Homes
- 316 N 10th Ave
- 338 N 9th Ave
- 280 N 14th Ave
- 359 N 16th Ave
- 453 N 15th Ave
- 960 Walnut St
- 335 N 7th Ave
- 174 N 7th Ave
- 719 Walnut St
- 1340 E Bridge St
- 680 N 15th Ave
- 1714 Jennifer St
- 1726 Jennifer St
- 1738 Jennifer St
- 1740 Jennifer St
- 50 N 6th Ave
- 1776 Windler St
- 1768 Jennifer St
- 126 S 9th Ave
- 484 N 21st Ave
- 327 N 11th Ct
- 301 N 11th Ct
- 330 N 11th Ave
- 340 N 11th Ave
- 337 N 11th Ct
- 320 N 11th Ave
- 312 N 11th Ct
- 324 N 11th Ct
- 300 N 11th Ct
- 350 N 11th Ave
- 336 N 11th Ct
- 349 N 11th Ct
- 290 N 11th Ave Unit F
- 290 N 11th Ave Unit E
- 290 N 11th Ave Unit D
- 290 N 11th Ave Unit C
- 290 N 11th Ave Unit B
- 290 N 11th Ave Unit A
- 290 N 11th Ave
- 358 N 11th Ave
Your Personal Tour Guide
Ask me questions while you tour the home.