Estimated Value: $101,000 - $182,000
--
Bed
1
Bath
793
Sq Ft
$160/Sq Ft
Est. Value
About This Home
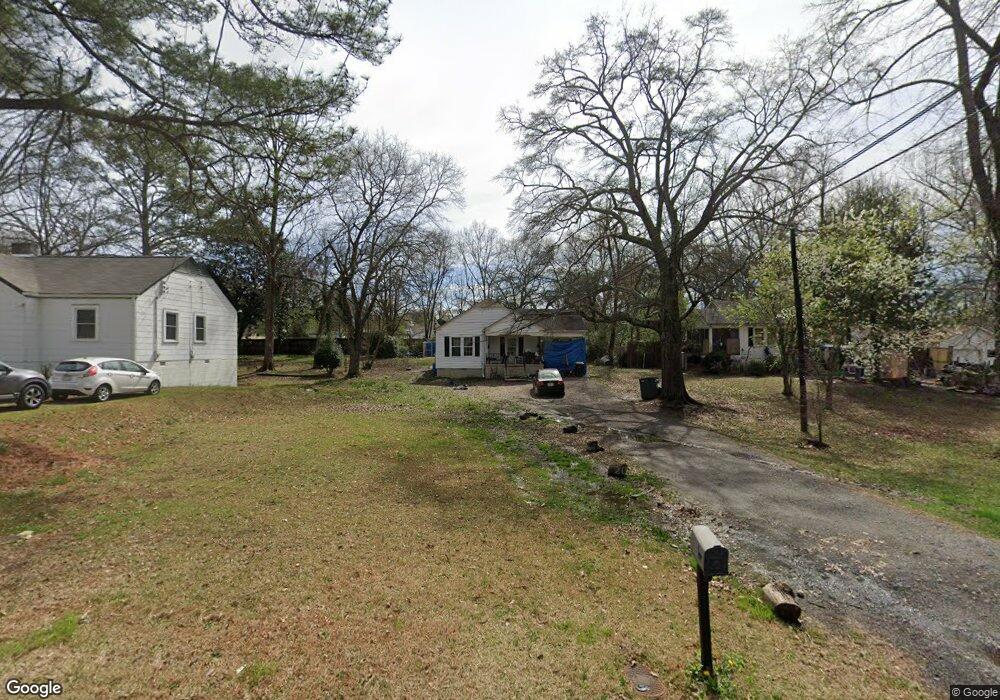
This home is located at 313 N Elm St NW, Rome, GA 30165 and is currently estimated at $127,179, approximately $160 per square foot. 313 N Elm St NW is a home located in Floyd County with nearby schools including Rome High School and St. Mary School.
Ownership History
Date
Name
Owned For
Owner Type
Purchase Details
Closed on
Sep 2, 2020
Sold by
Lopez Victor M
Bought by
Lopez Cornejo Enterprises Llc
Current Estimated Value
Purchase Details
Closed on
Sep 28, 2016
Sold by
Wayne John
Bought by
Lopez Cruz Victor M and Lopez Cruz
Purchase Details
Closed on
Sep 16, 2016
Sold by
Louise Mildred
Bought by
Adams John Wayne
Purchase Details
Closed on
Mar 5, 1979
Sold by
Lee Frances E
Bought by
Adams Mildred L
Purchase Details
Closed on
Jan 14, 1977
Sold by
Pine Log Land Co
Bought by
Lee Frances E
Purchase Details
Closed on
Dec 21, 1976
Sold by
Jackson Marvin L and Jackson Claudette
Bought by
Pine Log Land Co
Purchase Details
Closed on
Jan 14, 1974
Sold by
Carter Tommy Lee and Carter Sherie G
Bought by
Jackson Marvin L and Jackson Claudette
Purchase Details
Closed on
Dec 31, 1970
Sold by
Keown Hugh
Bought by
Carter Tommy Lee and Carter Sherie G
Purchase Details
Closed on
Nov 28, 1966
Sold by
Maxwell Madge Gresham
Bought by
Keown Hugh
Purchase Details
Closed on
Jan 1, 1901
Bought by
Maxwell Madge Gresham
Create a Home Valuation Report for This Property
The Home Valuation Report is an in-depth analysis detailing your home's value as well as a comparison with similar homes in the area
Home Values in the Area
Average Home Value in this Area
Purchase History
| Date | Buyer | Sale Price | Title Company |
|---|---|---|---|
| Lopez Cornejo Enterprises Llc | -- | -- | |
| Lopez Cruz Victor M | $14,400 | -- | |
| Adams John Wayne | -- | -- | |
| Adams Mildred L | $19,000 | -- | |
| Lee Frances E | $14,500 | -- | |
| Pine Log Land Co | $12,000 | -- | |
| Jackson Marvin L | -- | -- | |
| Carter Tommy Lee | $1,100 | -- | |
| Keown Hugh | $6,100 | -- | |
| Maxwell Madge Gresham | -- | -- |
Source: Public Records
Tax History Compared to Growth
Tax History
| Year | Tax Paid | Tax Assessment Tax Assessment Total Assessment is a certain percentage of the fair market value that is determined by local assessors to be the total taxable value of land and additions on the property. | Land | Improvement |
|---|---|---|---|---|
| 2024 | $1,272 | $32,737 | $8,505 | $24,232 |
| 2023 | $1,159 | $23,115 | $7,560 | $15,555 |
| 2022 | $783 | $21,460 | $6,300 | $15,160 |
| 2021 | $738 | $19,900 | $6,300 | $13,600 |
| 2020 | $656 | $17,545 | $4,725 | $12,820 |
| 2019 | $621 | $16,765 | $4,725 | $12,040 |
| 2018 | $633 | $17,089 | $4,725 | $12,364 |
| 2017 | $213 | $16,583 | $4,725 | $11,858 |
| 2016 | $597 | $17,360 | $4,720 | $12,640 |
| 2015 | $577 | $17,360 | $4,720 | $12,640 |
| 2014 | $577 | $17,705 | $4,720 | $12,985 |
Source: Public Records
Map
Nearby Homes
- 4 Homestead Cir NW
- 100 Dellwood Dr NW
- 15 Alexander St
- 8 Leon St SW
- 23 Sweetspire Dr NW
- 21 Sweetspire Dr NW
- 124 Sheridan Dr NW
- 40 Paris Dr SW
- 3 Walker Dr SW
- 103 Wooten Dr SW
- 4 Belmont Dr SW
- 8 S Hughes St SW
- 110 Williamson St SW
- 50 Melton Ave SW
- 3 Pebble Bend Ct
- 16 Jefferson Dr SW
- 808 Charlton St NW
- 0 Cedartown Rd Unit 10479932
- 209 Larkspur Ln SW
- 311 N Elm St NW
- 315 N Elm St NW
- 15 Homestead Cir NW
- 317 N Elm St NW
- N Elm St SW
- 309 N Elm St NW
- 17 Homestead Cir NW
- 312 N Elm St NW
- 310 N Elm St NW
- 11 Homestead Cir NW
- 319 N Elm St NW
- 307 N Elm St NW
- 314 N Elm St NW
- 107 Lamar St NW Unit 44-47
- 107 Lamar St NW
- 308 N Elm St NW
- 9 Homestead Cir NW
- 316 N Elm St NW
- 19 Homestead Cir NW
- 306 N Elm St NW